With headlines of inflation, market uncertainty, bank troubles, impending recession headlines, and geopolitical risks increasing, one can understand why money is running into hard assets. I have always maintained that gold (and silver because it follows the price action of gold!) will go up when there is a sense of a confidence crisis. When people are losing confidence in the government, the central banks, and the fiat currency, money will flow into gold.
Why? Well it is quite simple. Gold has always been accepted money regardless of what regime rules the land. It is also a proven way to protect purchasing power, which I believe will be a key theme going forward.
Those who still follow classical economics principles over keynesianism, follow the gold markets to see where inflation is heading. Gold is considered a currency to them, and when it breaks out against a certain fiat, it means that inflation is increasing. The monetary definition of inflation being a currency is getting weaker and thus, loses purchasing power. Put it another way: when a currency is weakening, it takes more of that weaker currency to buy the same amount of goods and services which leads to higher prices and inflation.
Here at Equity Guru, I notified readers that gold priced in various currencies have already confirmed new all time record highs. Against the British Pound, the Japanese Yen, the New Zealand Dollar, the Australian Dollar, and the Indian Rupee. All of these charts are still in their breakout and retest phase. But now, the focus will be on gold against fiat which is just a few dollars away from printing new all time record highs.
In this article, I will also give you my game plan for trading Gold/USD and what could cause a larger gold pullback.
But before that, we must talk about the recent news which has been causing a stir among precious metal investors. Let’s talk about silver.
It is no secret to my readers that I am a silver bull. For a hard asset, it remains cheap when you consider bullish factors such as a confidence crisis or the need for more silver for industrial/green energy purposes.
In these times of uncertainty, silver is seen as the more accessible and affordable hard asset to protect purchasing power for the middle class/ average person. As Norm Franz said:
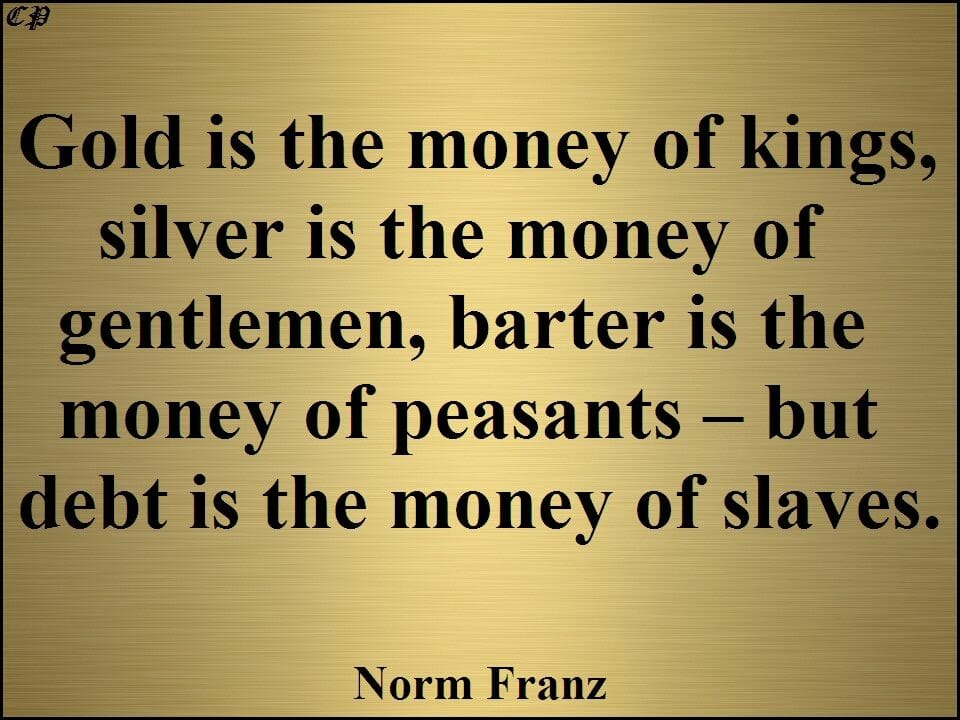
And the ‘gentlemen’ are certainly buying!
Global silver demand posted a record high of 1.2 billion oz in 2022. In fact, all major silver demand categories achieved record highs in 2022 pushing total demand to a new high of 1.24 billion oz. This represented an 18% increase in silver demand over 2021.
Since the global pandemic of 2020, global silver demand total has increased by 38%.
This comes as silver production from mines is decreasing. With this record demand, mine production came in totaling 822.4 million oz globally. At 228.2 million oz., output from primary silver mines rose only 0.1% in 2022 compared to 2021. The flat performance resulted from lower by-product output from lead-zinc mines, especially in China and Peru. However, production in Mexico, Argentina and Russia increased in 2022.
Recycling activity rose for a third year in a row with a 3% lift in 2022 to a 10-year high of 180.6 million oz.
Demand for silver in India jumped 24% followed by East Asia and then North America which saw demand increase by 7% and 6%. Europe registered a 6% drop in demand.
“As with jewellery, gains in silverware were almost entirely due to India on the back of employment and incomes returning to pre-pandemic levels,”
“India imported 9,500 tonnes of silver in 2022. Silver was looked at as a substitute to gold for jewellery and investment,” said Manav Modi, analyst, commodity and currencies, Motilal Oswal Financial Services Ltd
The Silver Institute expects another solid year for silver in 2023. Industrial fabrication is expected to reach an all-time high, boosted by continued gains in the solar market and other industrial segments. But demand from the bar, coin, and jewelry is forecast to fall short of last year’s levels, both are expected to remain historically high.
In terms of supply, 2023 is expected to achieve only low single-digit gains, leading to a projected 142.1 million oz. deficit, the second largest deficit in more than 20 years.
Adding up the supply shortfalls of 2021-2023, global silver inventories by the end of this year will have fallen by 430.9 Moz from their end-2020 peak. To put this into perspective, it is equivalent to more than half of this year’s forecasted annual mine production, and more than half of the inventories presently held in London vaults offering custodian services.
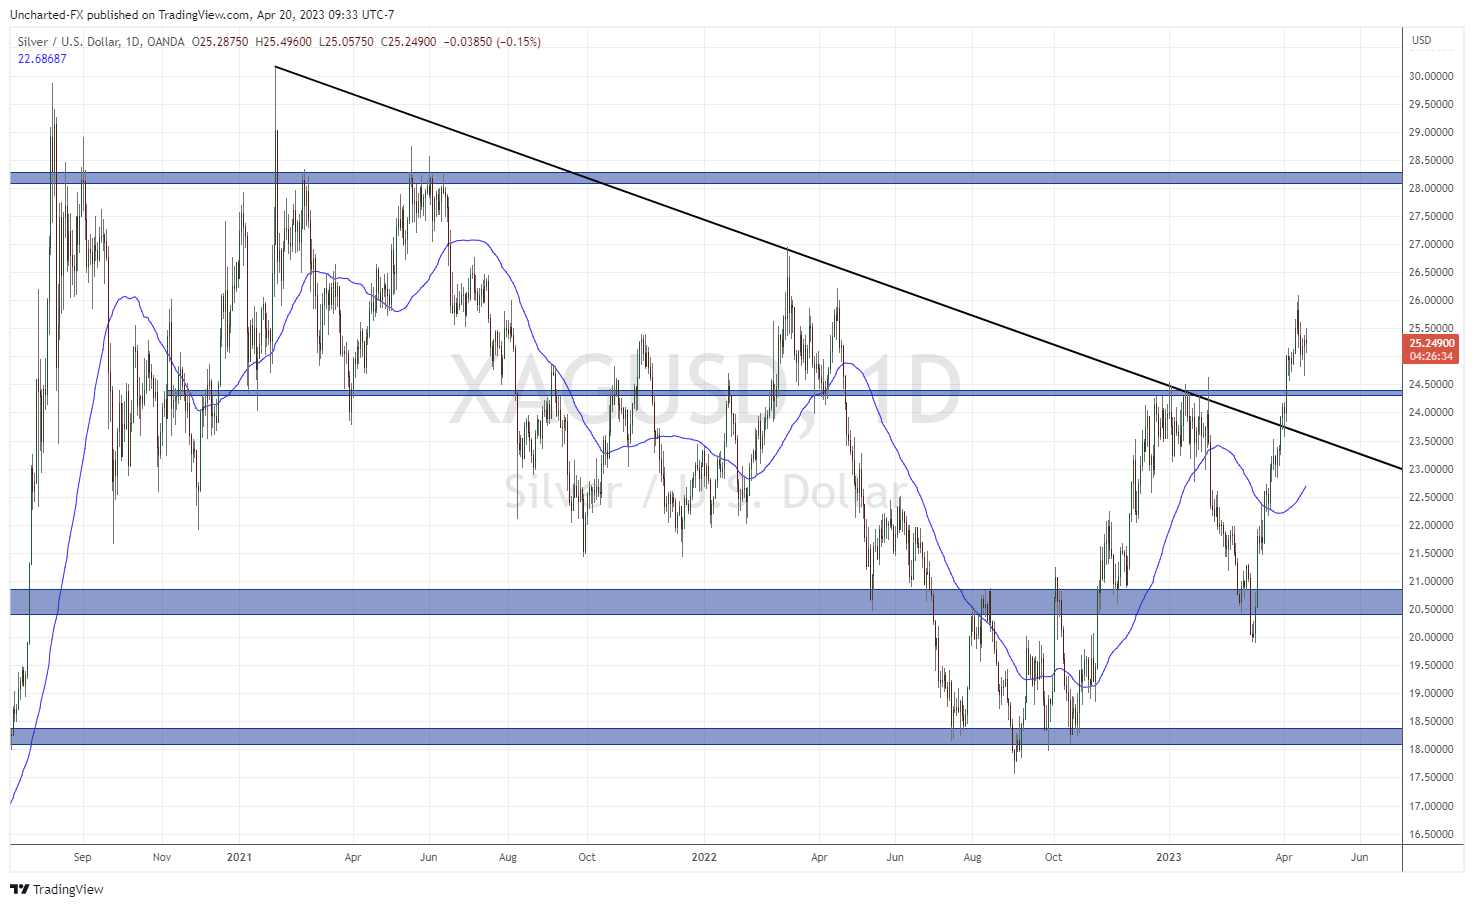
The fundamentals for silver look strong, and the technicals look very promising. A winning combination.
Above is the daily chart of silver. I have highlighted the downtrend line breakout in the past. Silver has broken out and is technically in a new uptrend. Going forward, the $24.30 zone is major support, however we remain positive as long as silver remains above the $23.50 zone being the retest of the broken trendline.
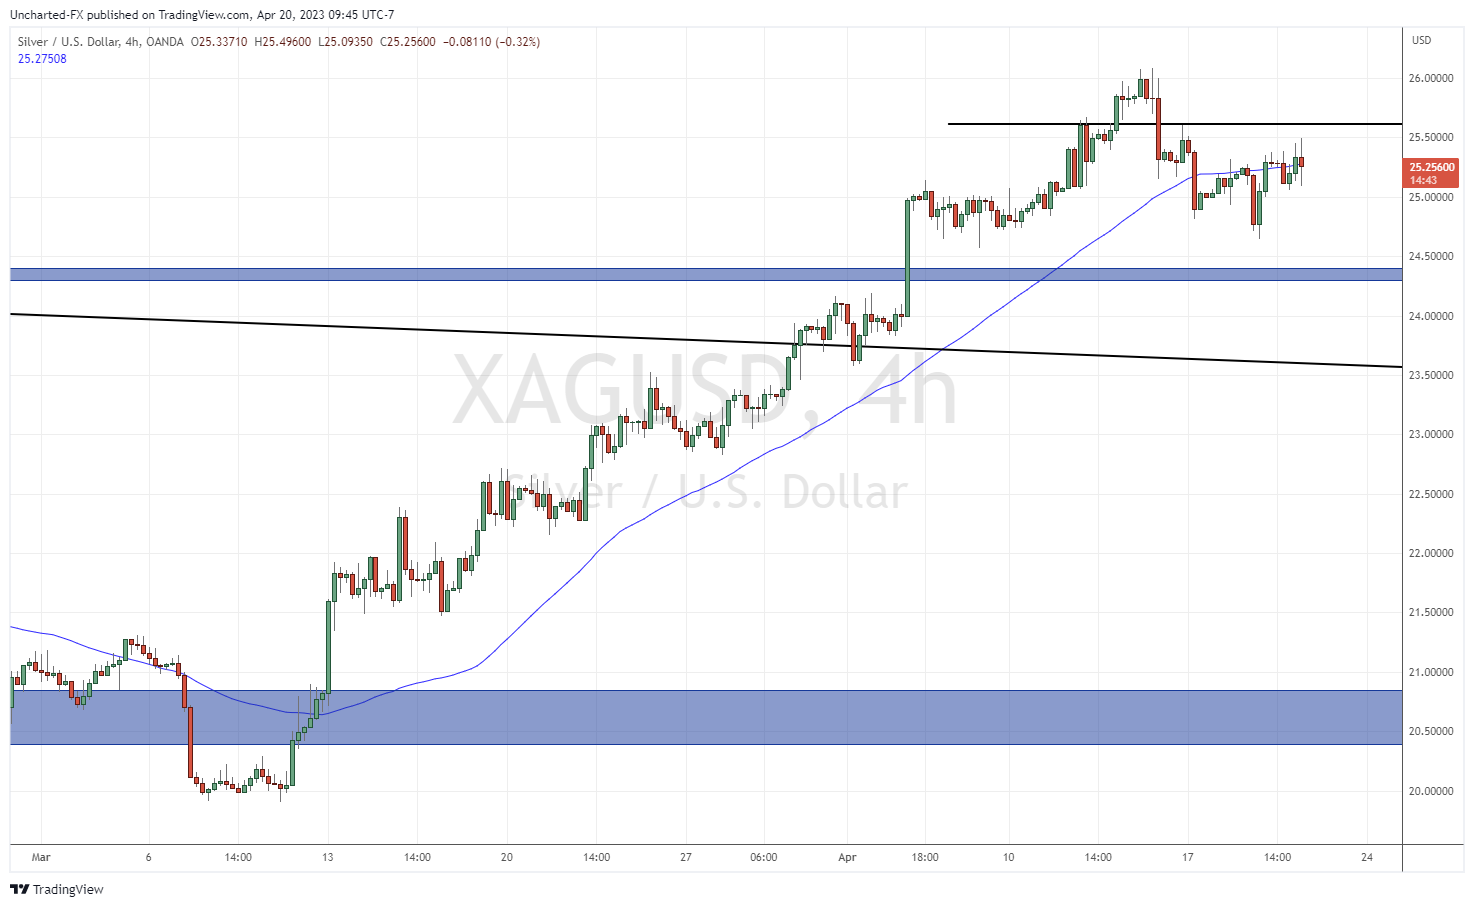
My game plan to go long silver requires a move down to the 4 hour or even the 1 hour chart. Silver on the long term daily chart is in a new uptrend. But an uptrend does not move up in a straight line. There are pullbacks and corrections.
It appears as if one is in progress on silver. I do not want to play the short because the overall trend is up. As they say, the trend is your friend. I want to wait for the correction to finish.
What is my signal? Await for an intraday lower high to be taken out.
My 4 hour chart has this line marked out at the $25.60 zone. I am patiently waiting for this level to be taken out on either the 4 hour or 1 hour chart before jumping in long. If we do not get this, then the correction can continue with silver falling lower. No problem. As long as our daily chart levels remain valid, the uptrend is still in play and we just wait for the break of the new lower high level which would develop on a move lower.
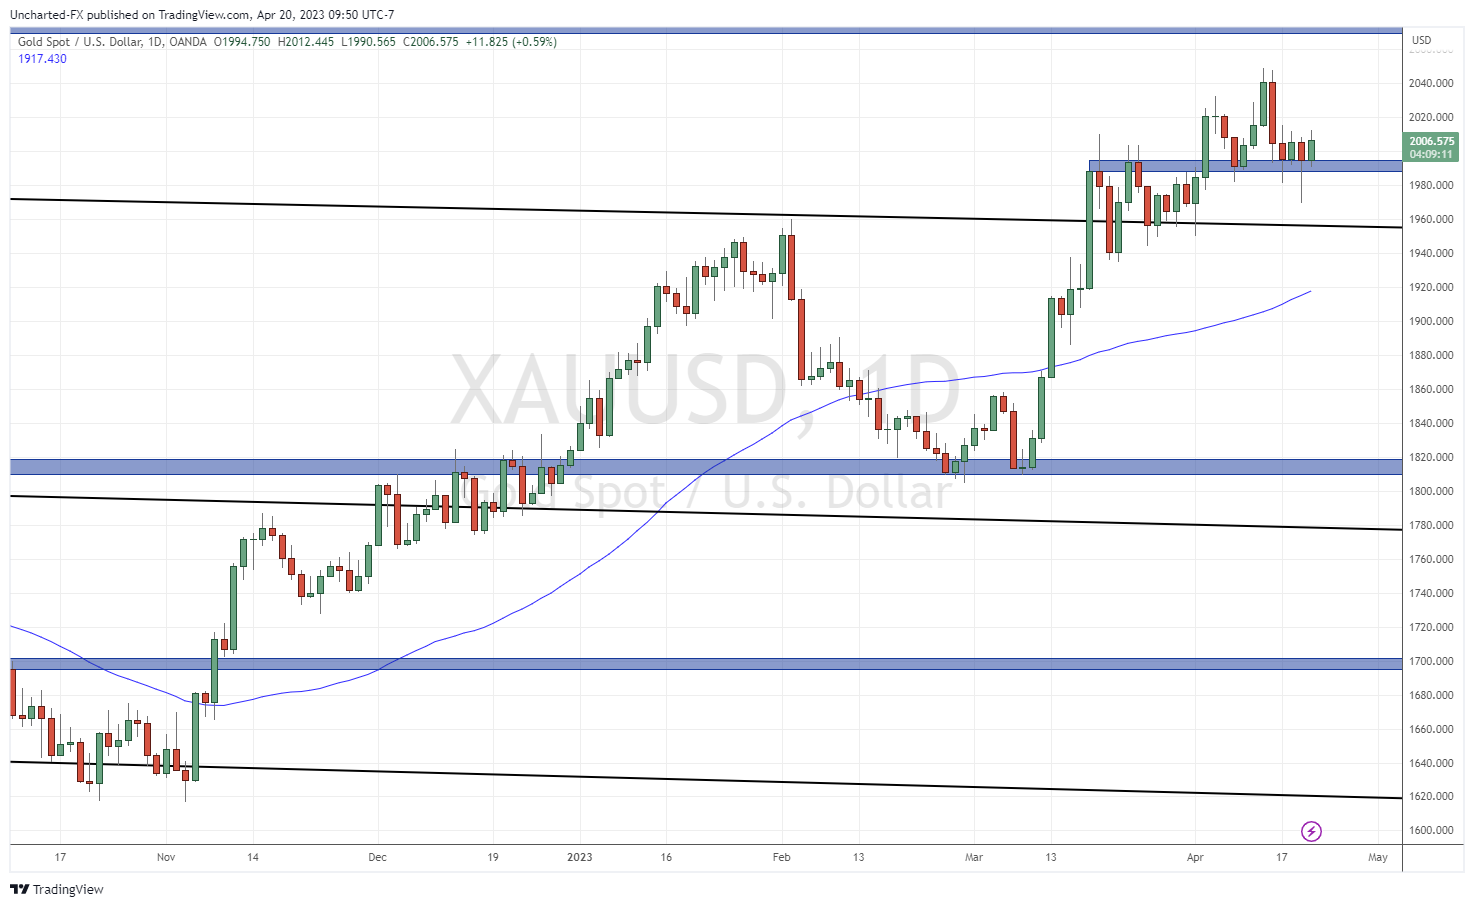
The same sort of analysis on gold. Gold is in a strong uptrend on the daily chart, and currently, there has been a correction to the $1990-$2000 zone. This zone is very important because it is the retest of the major breakout. We are now seeing a battle between the bulls and the bears here.
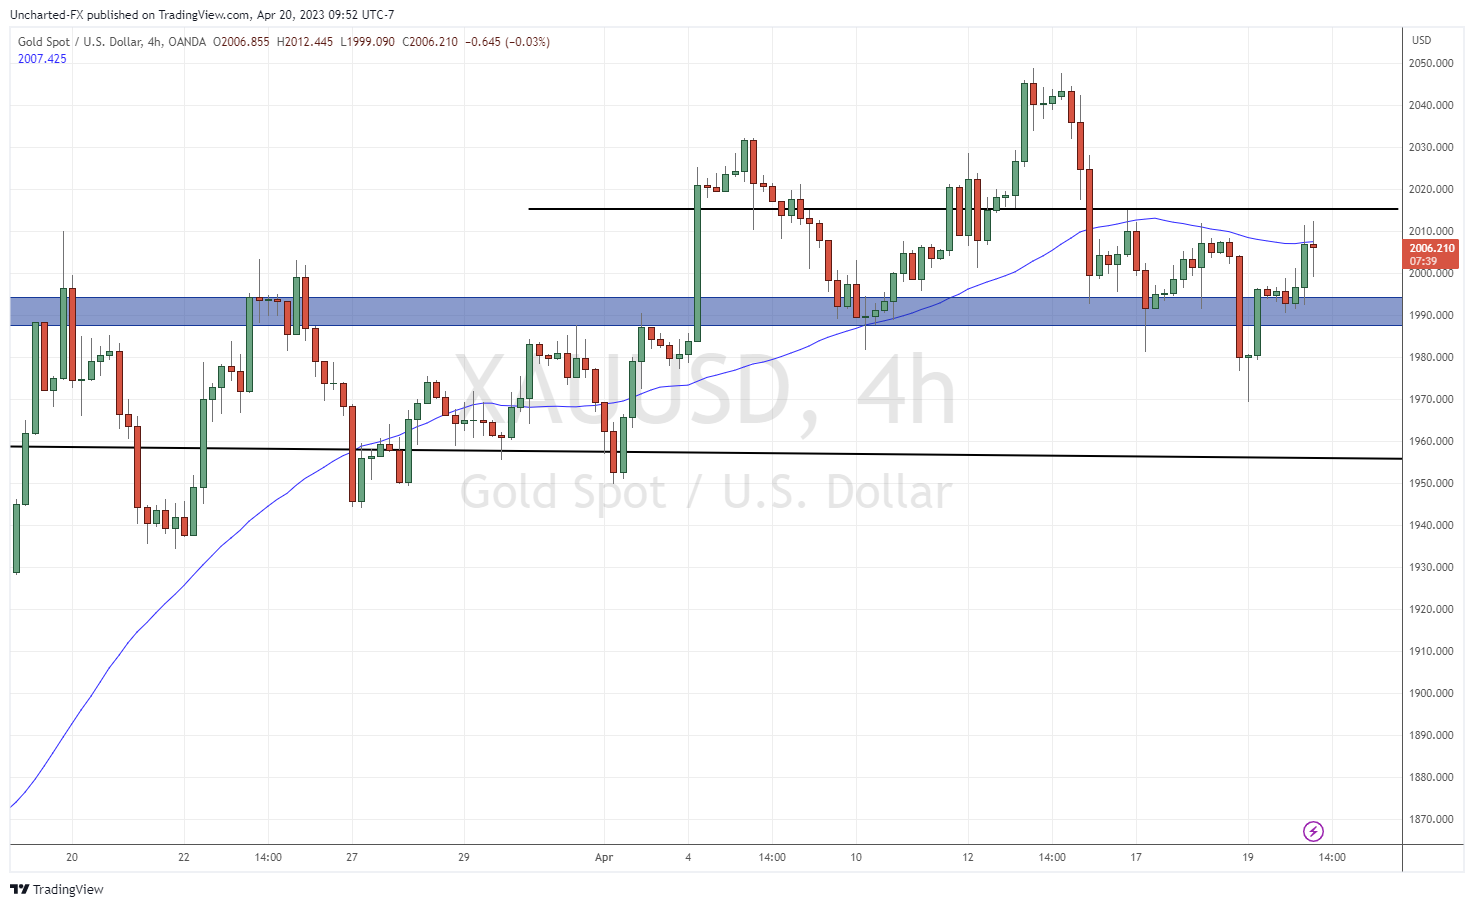
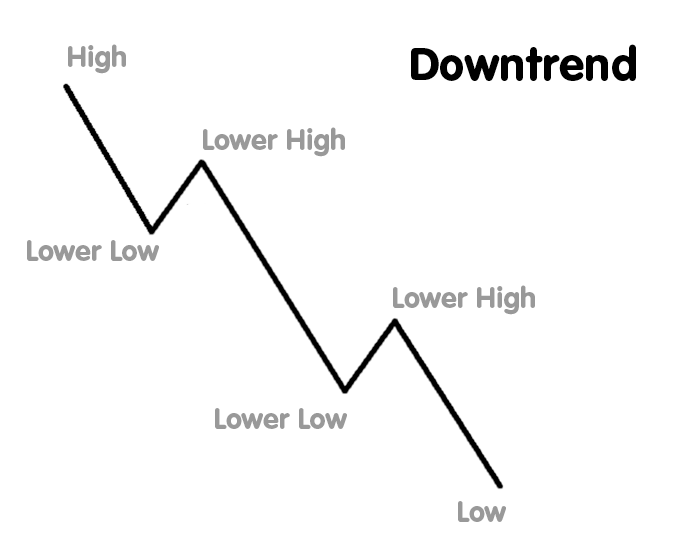
If we go down to the 4 hour chart, we can apply the same game plan as silver. Gold’s lower high is being tested around the $2015 zone. If we can confirm a nice close above this level on the 4 hour or 1 hour chart, it would mean the resumption of the uptrend. If not, then we continue to correct and will wait for the lower high to break.
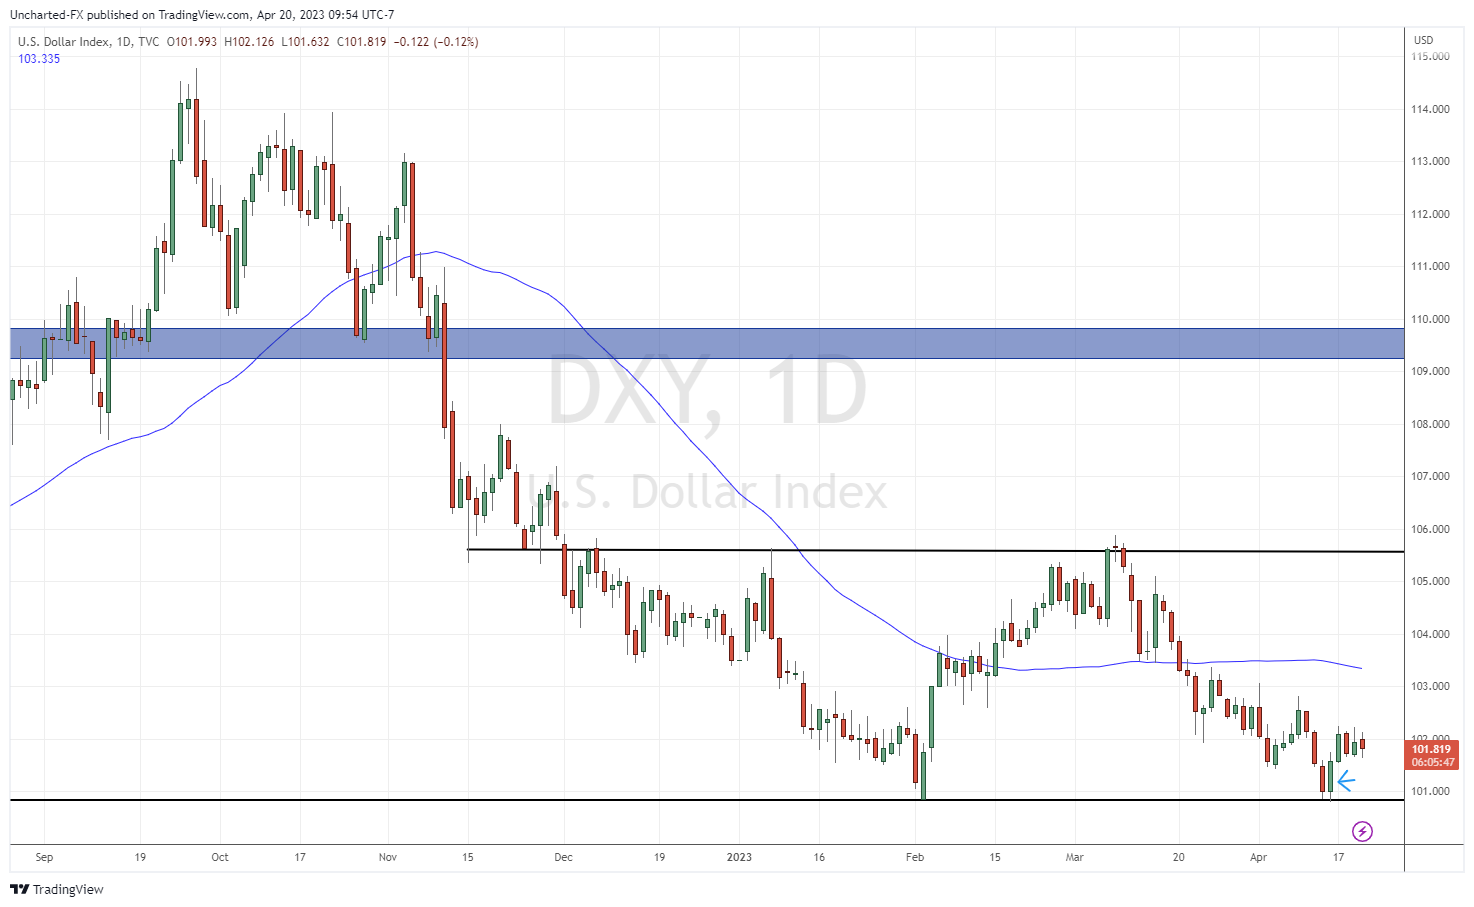
The US Dollar (DXY) chart is the one to watch for a potential further correction in the precious metals. A few days ago, I wrote an article titled, “Is the US Dollar ready for a new uptrend?“. I would recommend gold and silver bulls to read that piece.
In the article, I highlighted the fact that the US Dollar is in a major downtrend, but support has held. What increases the bullish probability is the Dollar printed an engulfing candle which I point out on my chart.
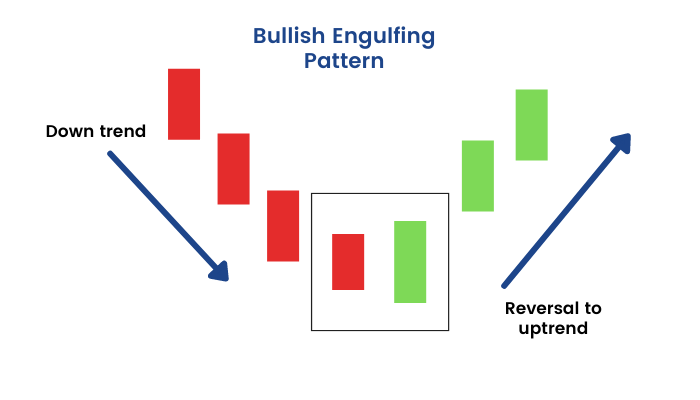
This is the most powerful single price action candle. It engulfed the previous candle, and occurred at major support which increases its validity. An engulfing candle tends to be the beginning of a reversal.
However, the same market structure applies to the Dollar. As long as the daily lower highs hold, the Dollar remains in a downtrend. If bulls manage to buy up the Dollar to get a close above the 102.80 zone, then this dollar reversal truly is confirmed and we would have a new Dollar uptrend in play. This is likely to hit precious metals UNLESS we have another reason such as banking fears or geopolitical developments which sees money run into the safety of precious metals.
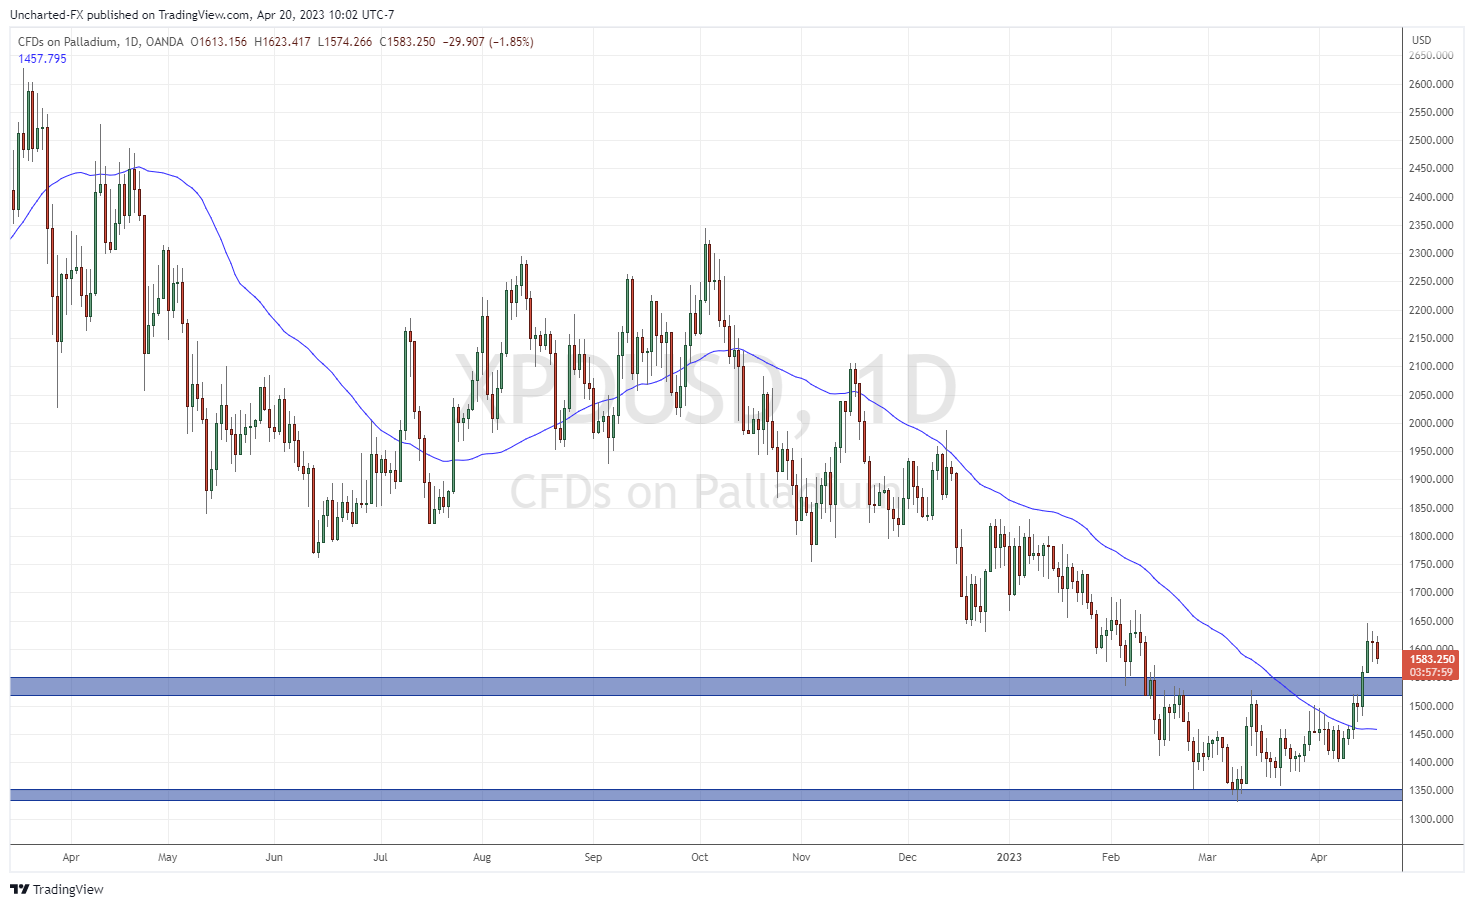
I will end this with a bonus chart. Palladium looks solid. We got a major breakout above $1500 and it appears as if a new uptrend has begun. Breakout and retest strategy now in play!

Leave a Reply