Gold and other precious metals were rocked last week and have broken below critical technical levels as the likelihood of a Fed soft landing diminish and the likelihood of a recession increases.
In the month of June, the Fed ‘paused’ raising interest rates, but Powell did mention the Fed is looking to raise rates two more times this year. Markets really did not care. A few days later, Powell reiterated that the battle against inflation is not over yet, and the ‘pause’ is just temporary. That nearly all Fed members expect more rate hikes this year.
Powell still sounds like a hawk, and this has the markets turning. So much so that some financial mainstream media sites are running articles on Powell and the Fed breaking the bull market.
Not one to toot my horn, but recently I warned traders, investors and market participants that the US stock markets are approaching a key resistance zone. One which could see the beginning of a new downtrend.
With a still hawkish Fed, and more rate hikes likely coming by the end of the year, the real economy is definitely going to feel it. Higher rates means that the economic slowdown and a recession is likely probable. The Bank of Canada did a surprise rate hike and said more can come. The Bank of England last week raised rates by 50 basis points taking the base rate to 5%. 5.50% is expected. These rate hikes caused analysts to reconsider economic projections in these nations. Let’s not forget that China is cutting rates because their economy is slowing down.
With these headlines, we are seeing the commodity space take a dump. Oil prices remain weak. Copper is showing signs that it wants to resume a downtrend. And the precious metals have broken down.
With a bullish Fed means we must address a few charts. Both which affect the price of gold.
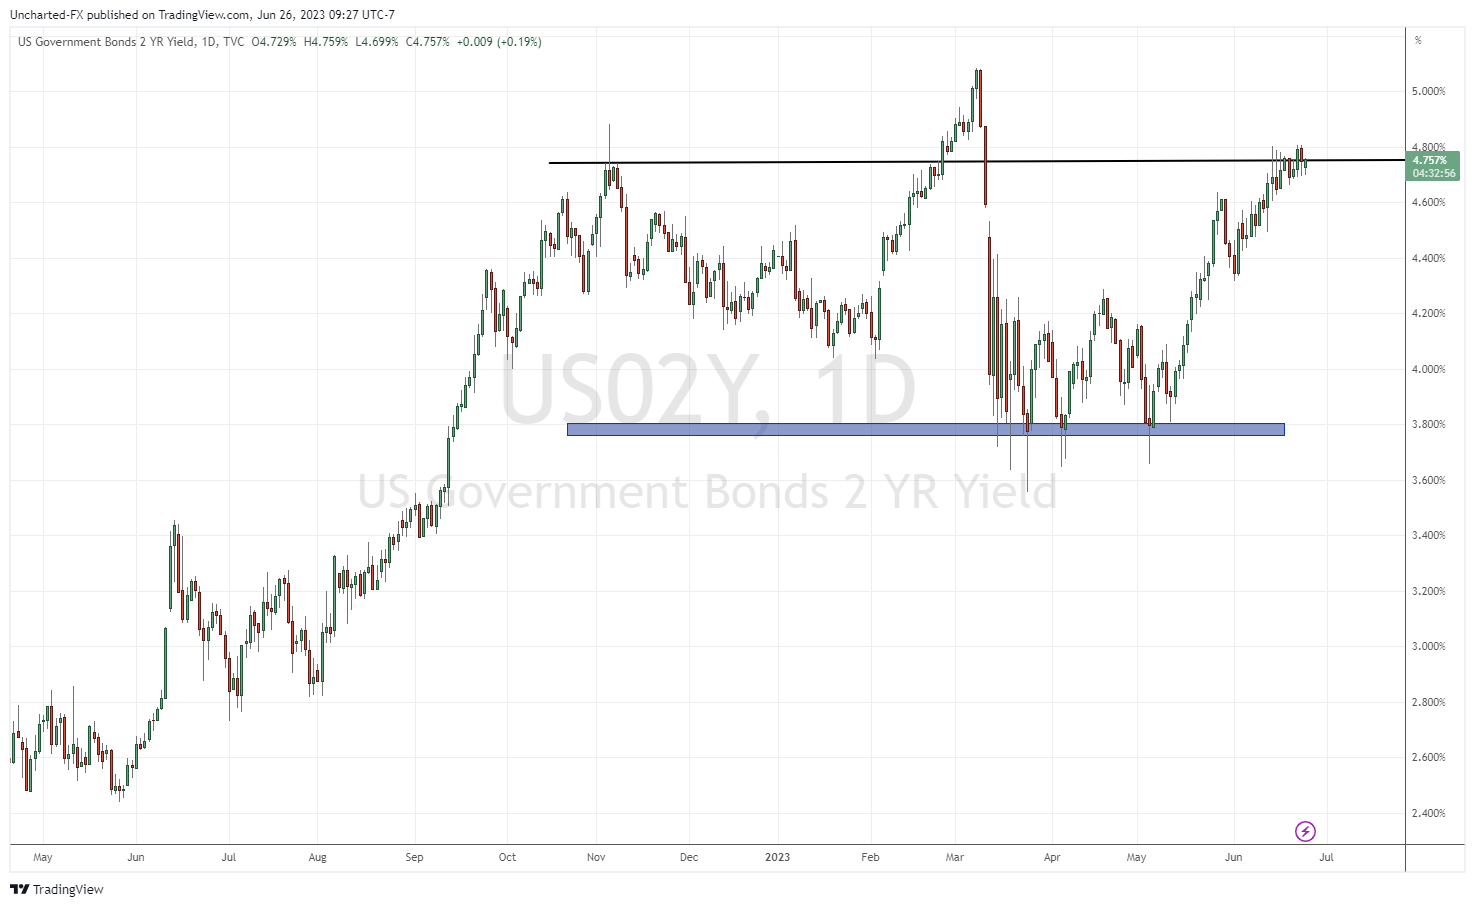
The two year yield continues to climb. For gold traders, the peak and then reversal on March 8th-9th is when gold bottomed and then reversed. When yields rise, gold tends to fall because it does not yield anything. Thus when REAL YIELDS rise, gold price falls. I capitalize real yields because of course this factors inflation. With the current inflation rate, real yields are still negative. But if rates rise and inflation falls then real yields will go positive. With the Fed saying more rate hikes are coming, this could be the scenario the gold market is pricing in.
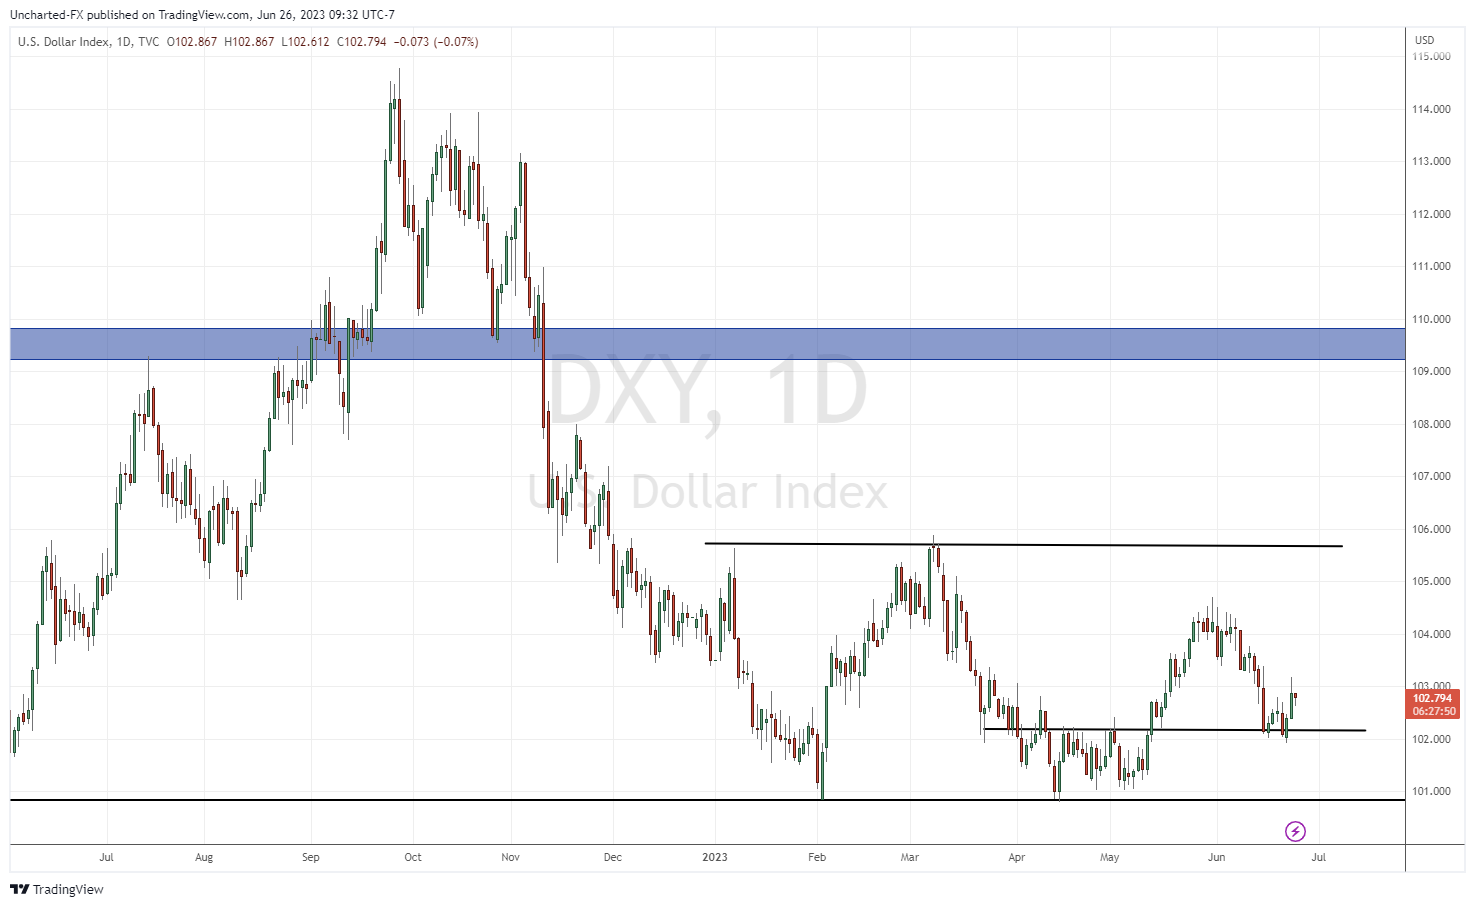
We then need to discuss the US dollar. Gold is seen as the anti-dollar thus there is a negative correlation between the two. Generally when the dollar rises, gold drops and vice versa.
The dollar has been in a clear downtrend. Then in late April and early May 2023, the US dollar began to show signs of a range. From a market structure standpoint, this is a key component as a range after a long downtrend tends to indicate that the selling pressure is over and a new trend may begin. In this case, is a new uptrend about to begin in the US dollar given the hawkish Fed statement?
We have broken above the range and are now pulling back. This is normal after a breakout. Price tends to pullback to retest the breakout zone. The dollar did this recently when it retested the 102 zone. It does appear as if buyers are stepping in. As long as 102 is held, the dollar can continue momentum higher to take out recent highs around 104.30 to continue the uptrend. A close below 102 gets us back in the bearish trend.
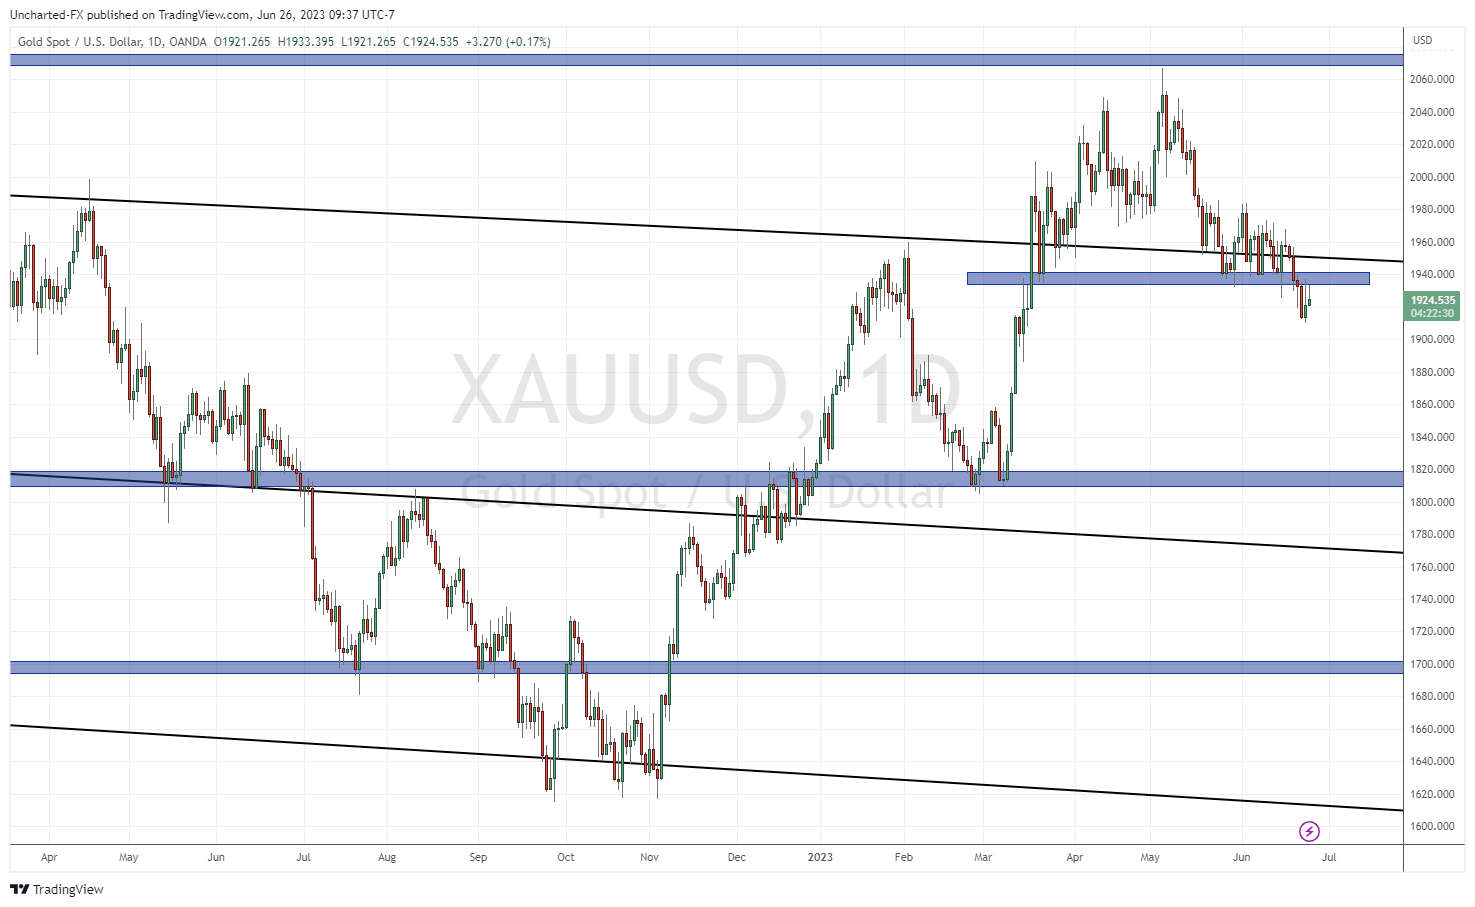
Gold has just been ranging between $1980 and $1940 since May 18th 2023. And it looks like we finally got the break, but not the break bulls have been looking for. Gold has closed below the price floor of the range and is retesting what was once support. Sellers are jumping in as indicated by the long wick candles.
As long as the price remains below $1940, gold will head lower. A close below $1900 looks probable with support targets coming in at $1860 and then $1820.
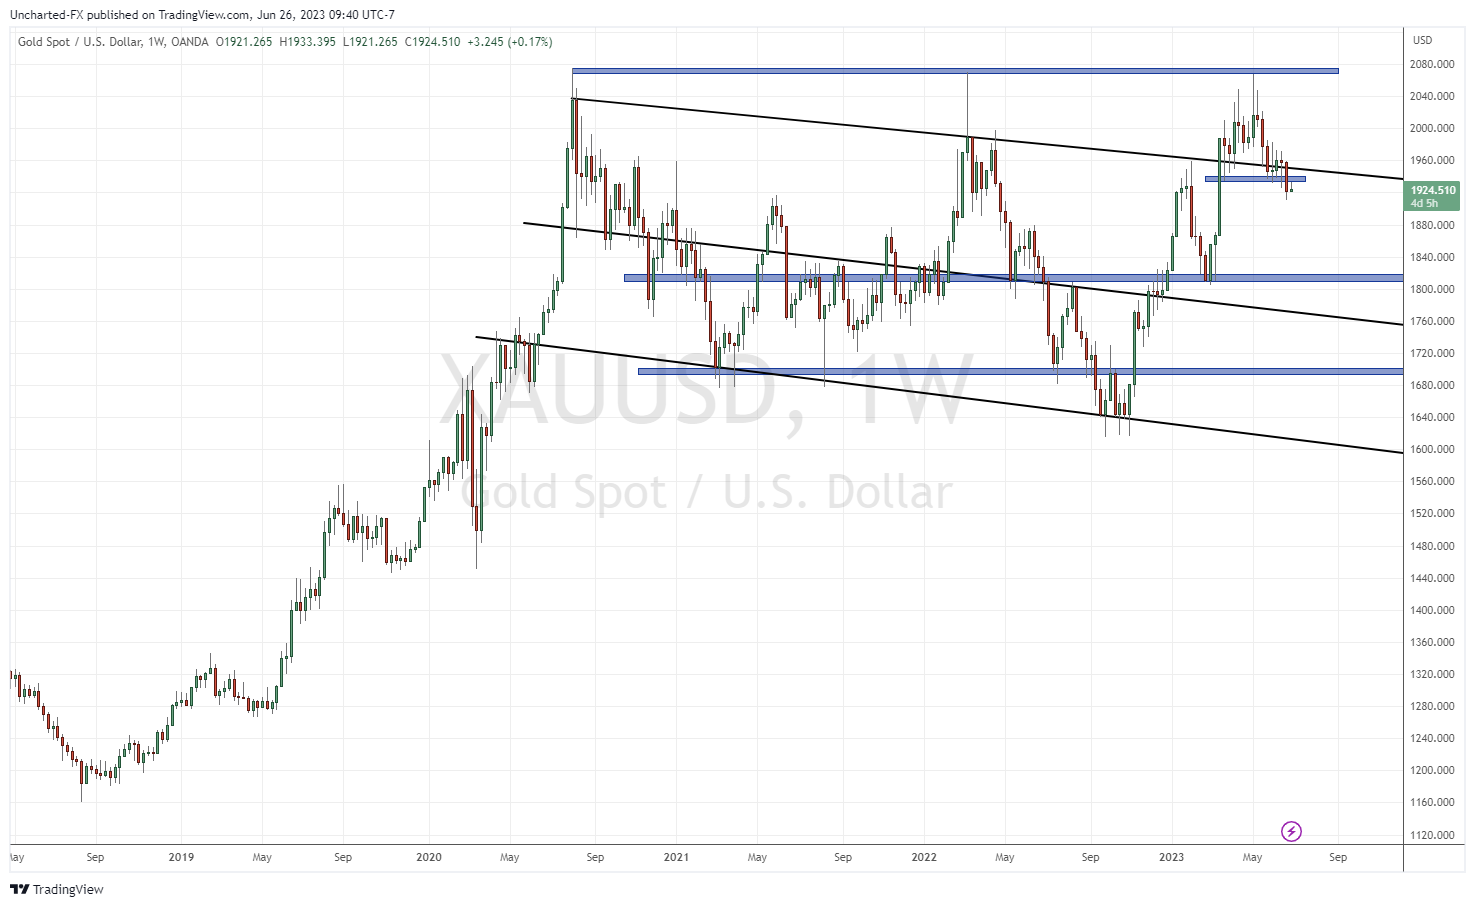
Another bearish trigger has been confirmed on the weekly chart. I have outlined this channel pattern which saw a breakout. Since then, gold has pulled back to retest this breakout. Last week’s weekly candle confirmed a breakdown back below the channel trendline which was acting as support. The breakout did not hold. The technicals point to more weakness in gold.
What about the technical bullish case? If the retest fails and gold closes back above $1940 on the daily chart, we then will have a confirmed false breakdown or fake out.
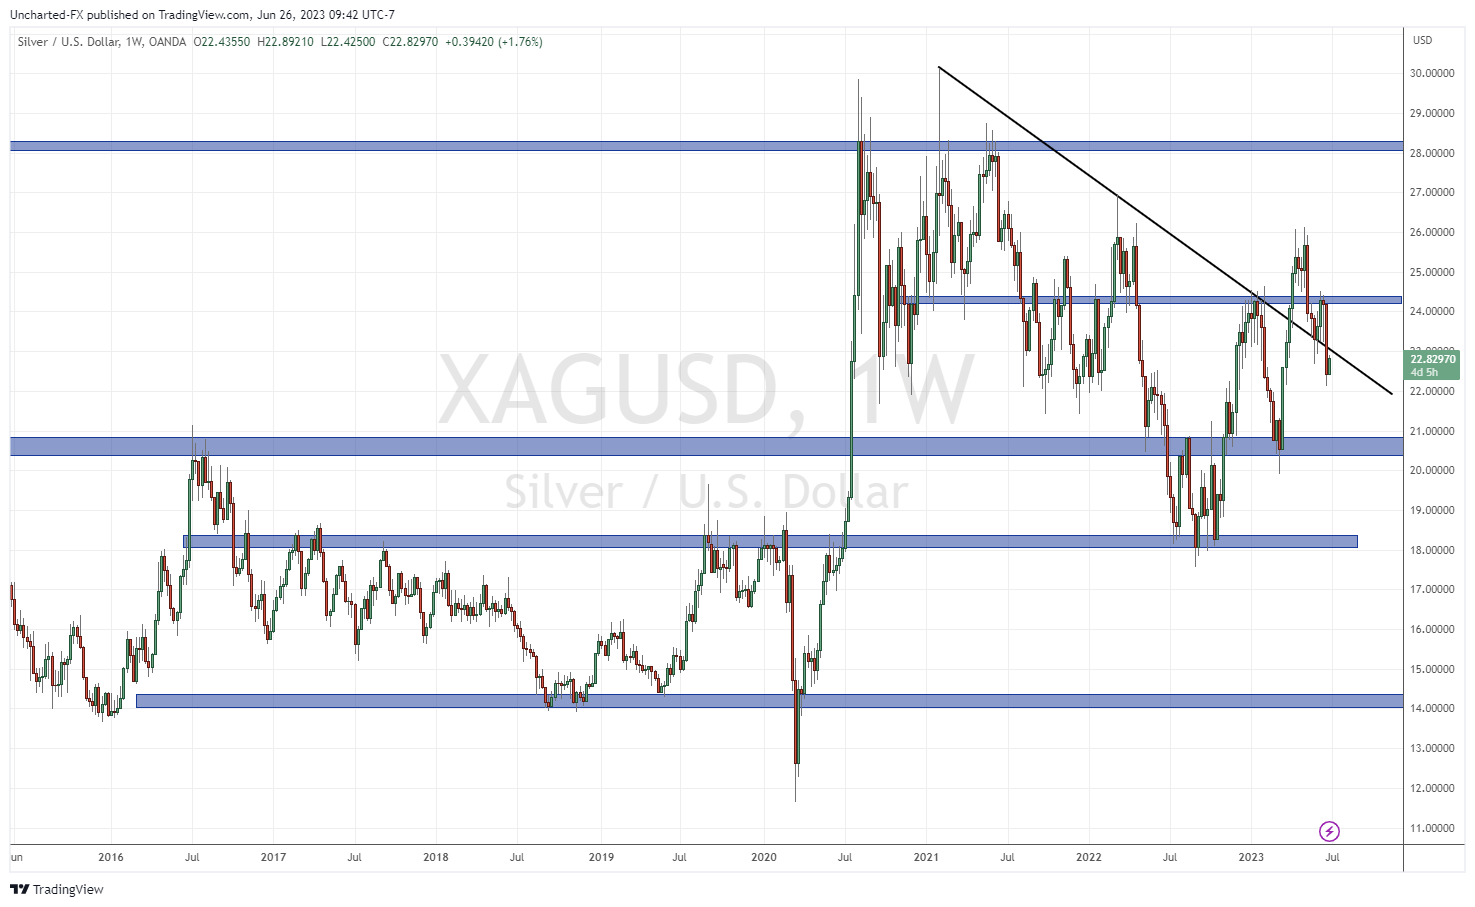
If we take a quick look at silver, we see that a weekly trendline breakout has also been invalidated with last week’s candle close. More weakness would see silver fall back down to the $20.50-$21 zone.


Leave a Reply