The uranium spot price market continues to climb as the momentum from a recent technical breakout continues. Before we jump into the charts, let’s take a look at the fundamentals. If you follow this market, then I am sure you know why uranium is in a bull market. It is all about nuclear energy to combat climate change and some geopolitics involved as well.
When it comes to the fundamentals, Trading economics sums up the recent headlines nicely:
Uranium prices rose toward $56 per pound, halting a four-week decline and remaining relatively close to the 14-month high of $57.75 touched in June amid growing concerns about supply risks from Russia. Exports of nuclear fuel from ports of St. Petersburg to the United States were halted due to the lack of proper insurance coverage, interrupting supply and consolidating worldwide concerns that prolonged geopolitical tensions with Moscow will reshape supply chains despite no formal sanctions being passed. Efforts by US and European utilities to shun Russian nuclear fuel stress the limited capacity of local production streams as Russia is responsible for nearly half of the world’s capacity for uranium conversion and enrichment, according to the latest data. Meanwhile, major economies continue to announce plans to increase nuclear power capacity to strengthen energy security and lower carbon emissions, solidifying expectations of strong uranium-buying activity for decades to come.
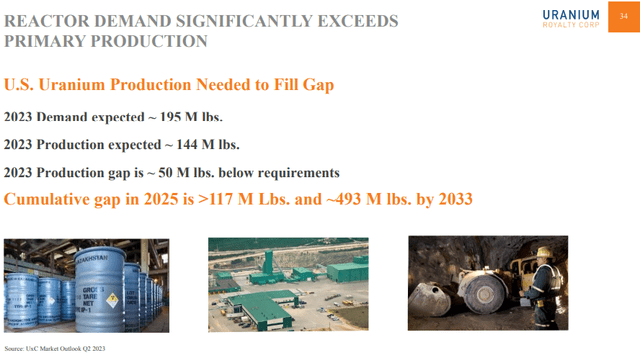
That’s pretty much the bullish case and why investors remain excited about the price of yellow cake. While commodities were struggling (most of that changed post US CPI data!) uranium remained hot. It remains to be seen how commodities will react if the probabilities of a recession increases, but the uranium market will remain in a deficit due to increased demand and lack of new supply. This supply and demand imbalance usually means higher prices.
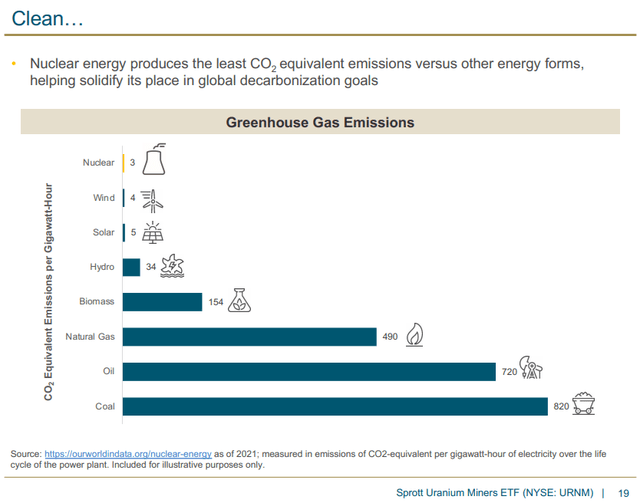
Even if there is an economic slowdown, governments will be looking at uranium to reduce their carbon footprint and prevent an energy crisis. Wind and Solar are not an all-rounded solution. Both are at the mercy of the weather. No sun? Not windy? Well, your power generation is zero. And with weather becoming unpredictable, who wants to take that gamble. Nuclear energy is the choice for handling base load power generation while reducing reliance on carbon intensive sources. When it comes to baseload, nuclear energy is the clear winner with over 90% capacity factor.

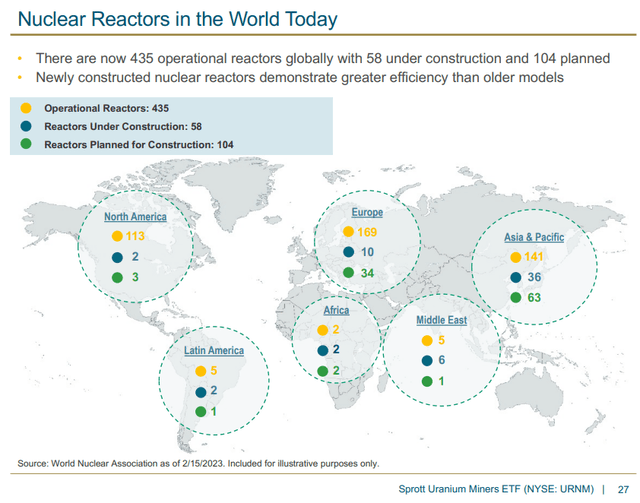
All of these fundamentals and future challenges are leading investors to bet on a nuclear renaissance. It should be noted that even public and government opinion on nuclear energy is turning. Nuclear energy and power plants used to be seen as dangerous and scary things thanks to Chernobyl and Fukushima. But people are now being educated and realize that those nuclear power plants were old. Today, modern nuclear power plants are some of the safest buildings in the world. I recall Marin Katusa saying at a VRIC conference how the media did not talk about the people in Fukushima running to the MODERN nuclear power plant there for safety as the rising walls prevented the tsunami waters from entering the plant.
The uranium market outlook looks bright. And if you believe prices are going higher, then uranium equities is where you want to be. Uranium equities have outperformed during uranium bull markets:

Technicals
From a technical analysis perspective, things look super bullish.
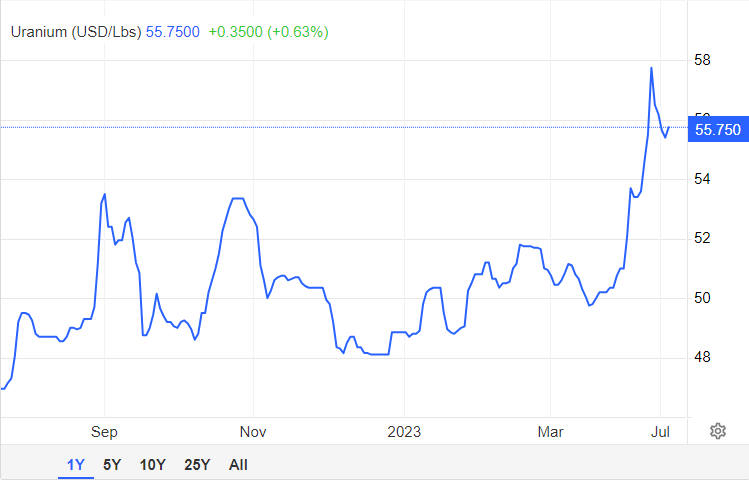
Let’s start with a zoomed in chart going back 1 year.
In previous articles, I talked about the major psychological level at $50. When uranium was pulling back, I told readers that we should be watching to see how price reacts here. If we broke below, then uranium, and other uranium stocks, were in danger of confirming a reversal pattern known as the head and shoulders pattern. This pattern actually triggered on uranium equities, but it turned out to be a fakeout as price managed to cross back over the head and shoulders neckline on the retest invalidating the reversal pattern and more importantly, more downside.
The breakout above recent 2023 highs just below $52 sparked major momentum. Momentum that saw spot price breakout above resistance at $53.60. Not only this, but in May 2023, price pulled back briefly to retest this zone before continuing the bull run thereby validating the breakout and retest. If this is all too much with technical terms, all you need to know is that the technicals confirm bullish price action.
So where to next?
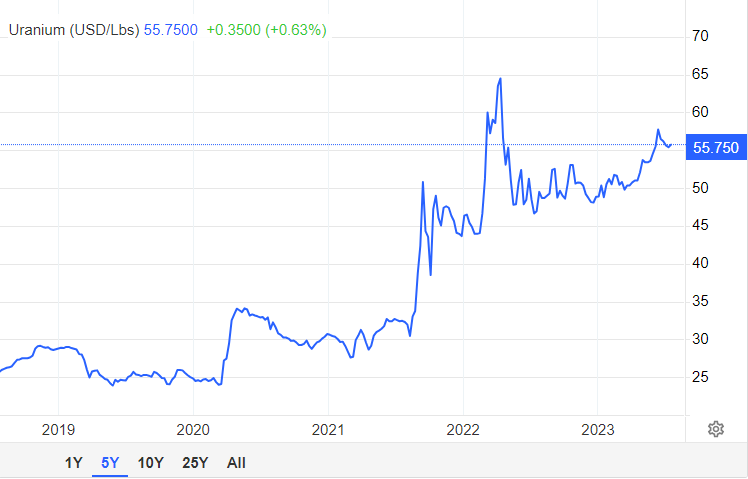
Going to a longer time frame chart and one can see how important the recent $53.60 breakout was. Not only was it 2023 recent highs, but also a major flip zone going back to 2022. The retest confirms the higher low we are working with. As long as the uranium spot price remains above $53.60, the uptrend continues and we should expect to see higher prices.
$60 is the next big whole number coming up, but really the next major high comes in just below the $65 price level. This would be the next target for the rest of 2023, and a break above this would see real mania take over this sector.
Let’s take a look at the price action of other charts.
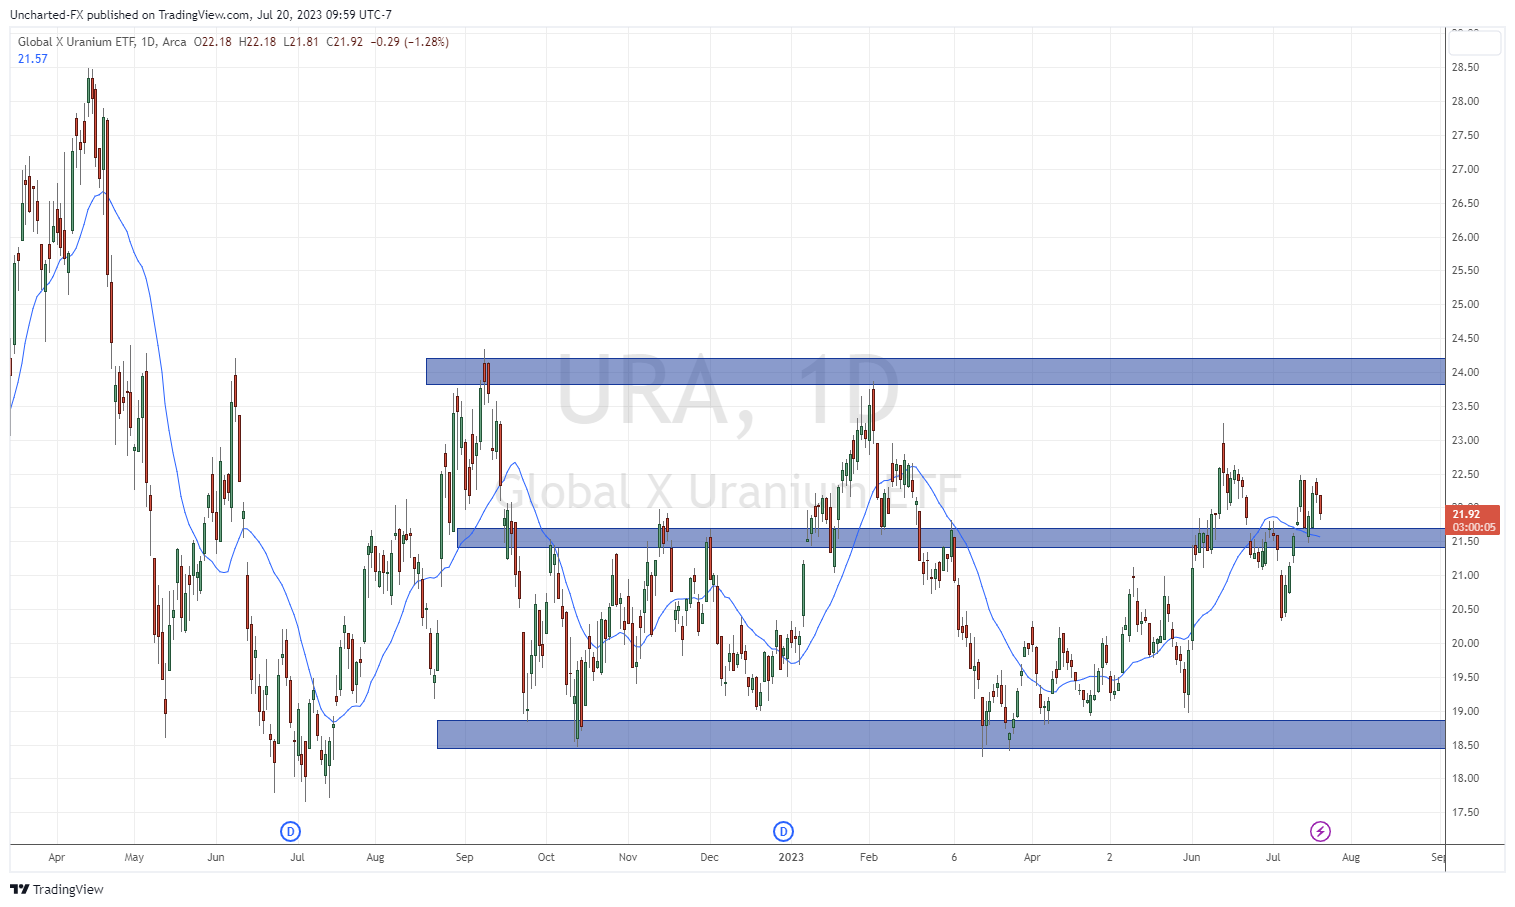
The Global X Uranium ETF, URA, is also back above the major resistance zone of $21.50. Note the head and shoulders reversal trigger which was printed back in February 2023. We did cross back over the neckline in June but briefly. Recent price action has crossed back above $21.50 and the important thing is the retest on the pullback saw buyers step in. This did not happen in June 2023. $24 is in play as long as the price remains above $21.50.
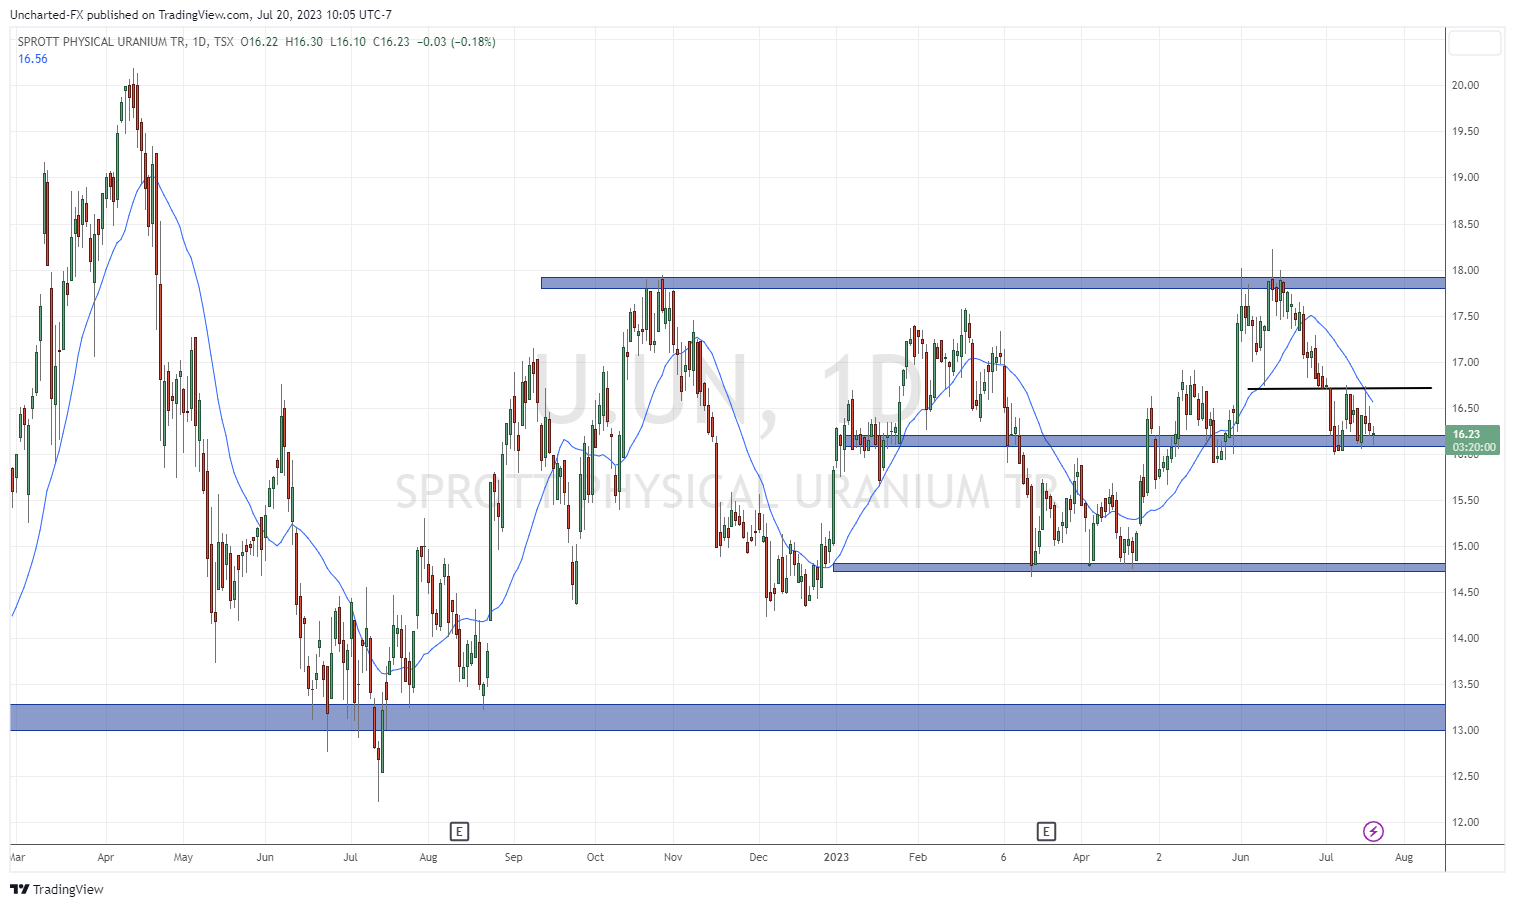
I am closely watching the Sprott Physical Uranium Trust. This stock is testing a key support zone right now. A support zone which should see buyers jump in, and therefore, presents an interesting possible entry point at time of writing. So far the current daily candle is showing a large wick indicating buyers are stepping in. I would be watching for a large green candle, preferably an engulfing green candle whose body ‘engulfs’ the previous red bodied candles.
I would also watch for a close above $16.75, which is where I have drawn that black horizontal line. This is because U.UN has begun to range and this level is currently the recent resistance. A close above would be considered a breakout and would point to the continuation of the uptrend. The $18 zone remains upside resistance.
Leave a Reply