“Interest rates will remain higher for longer”. This is what most analysts can agree upon after yesterday’s Federal Reserve conference. It was quite a strange one. Powell did not want to give concrete answers to questions regarding if the Fed is done with hikes. But we know that there is one more rate hike coming by the end of 2023.
The Federal Reserve left interest rates unchanged and if the Fed does go ahead with the one more planned hike by the end of the year, it would make a full dozen rate hikes since tightening began in March 2022. Even though the markets had priced no hike, there still is some uncertainty over where the Fed goes from here. And this can be reflected in the stock market reaction post Fed.
Powell maintained a slightly hawkish tone:
“We’re in a position to proceed carefully in determining the extent of additional policy firming,” Powell said.
“We want to see convincing evidence really that we have reached the appropriate level, and we’re seeing progress and we welcome that. But, you know, we need to see more progress before we’ll be willing to reach that conclusion,” he said.
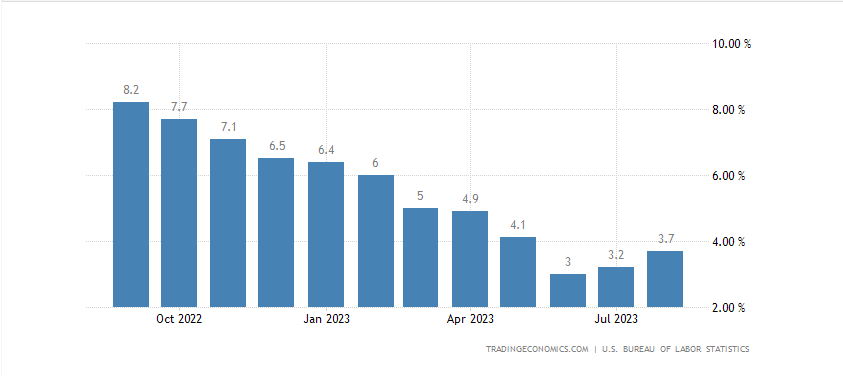
US CPI inflation is beginning to rise again, and rise away from the Fed’s 2% threshold. With oil prices rising, it is likely we see inflation ticking higher. But once again, what comes next? Will one more rate hike really be enough to tame inflation? Or will inflation continue higher resulting in the Fed having to raise more which would cause immense volatility in the markets as the markets would have to price all this in.
What we can all agree upon is that interest rates will remain higher for longer.
A lot of talk was about the Fed’s dot plot. It showed one more rate hike this year, then two cuts in 2024, two fewer than were indicated during the last update in June. That would put the funds rate around 5.1%. The plot allows members to indicate anonymously where they think rates are headed.
Over the longer term, FOMC members pointed to a funds rate of 2.9% in 2026. That’s above what the Fed considers the “neutral” rate of interest that is neither stimulative nor restrictive for growth. This was the first time the committee provided a look at 2026. The long-run expected neutral rate held at 2.5%.

But Powell has said:
“It’s a culmination of individual forecasts from 19 people, and then what you’re seeing are the medians,” Powell said Wednesday. “So I wouldn’t want to bestow upon [the dot plot] the idea that it’s really a plan.”
Nonetheless it is the talk of the street. Especially given that according to the dot plot, some Fed members expect rates to remain high going into 2026.
Now let’s take a look at how certain markets are reacting post Fed.
Let’s start with bond yields.
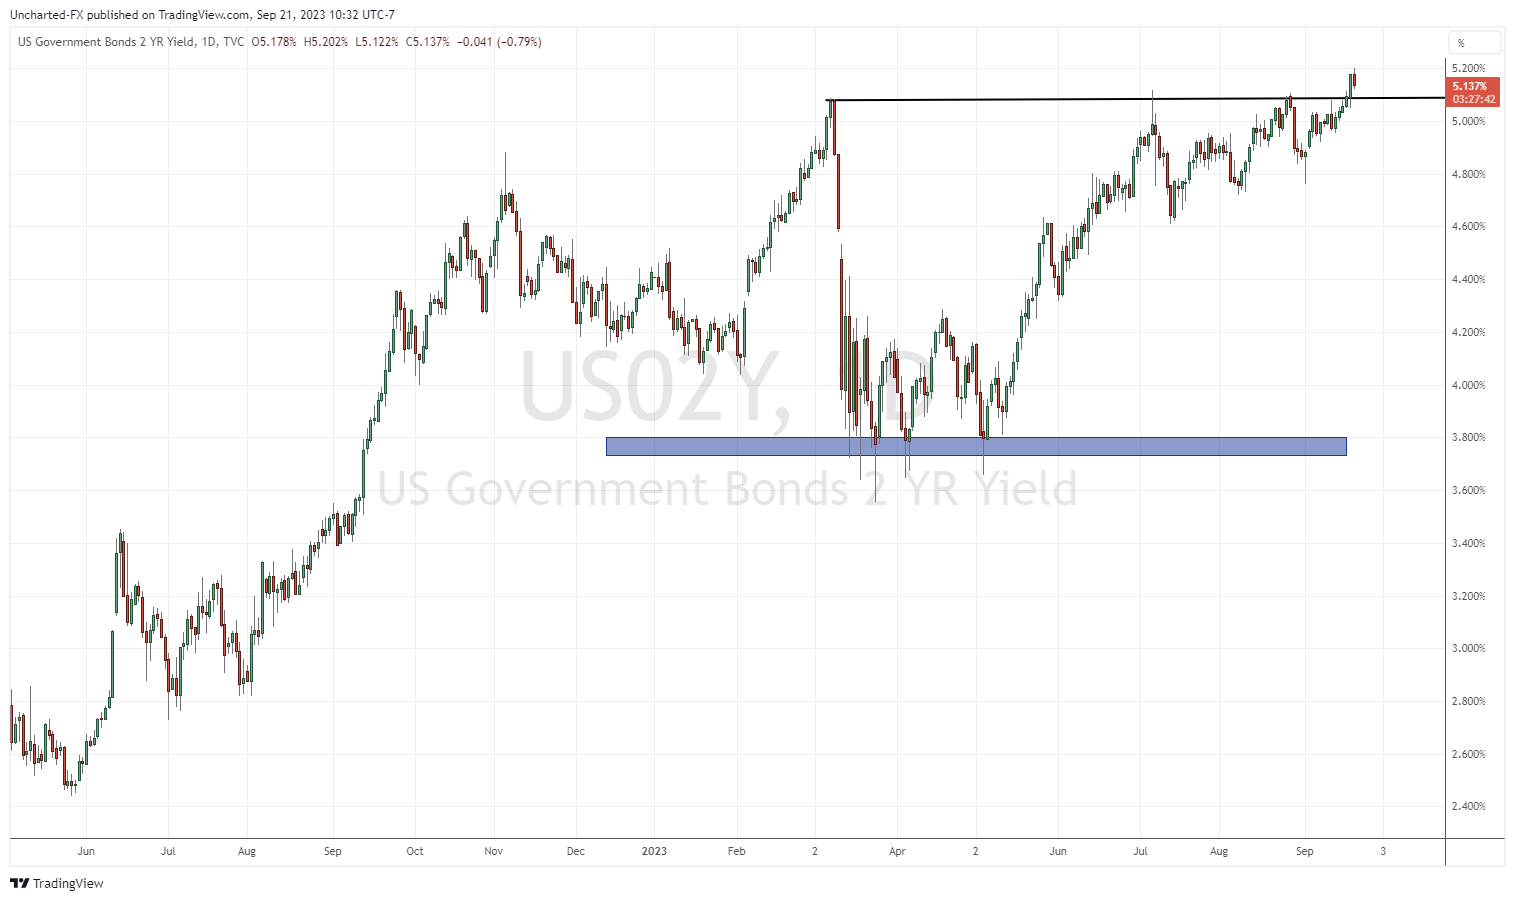
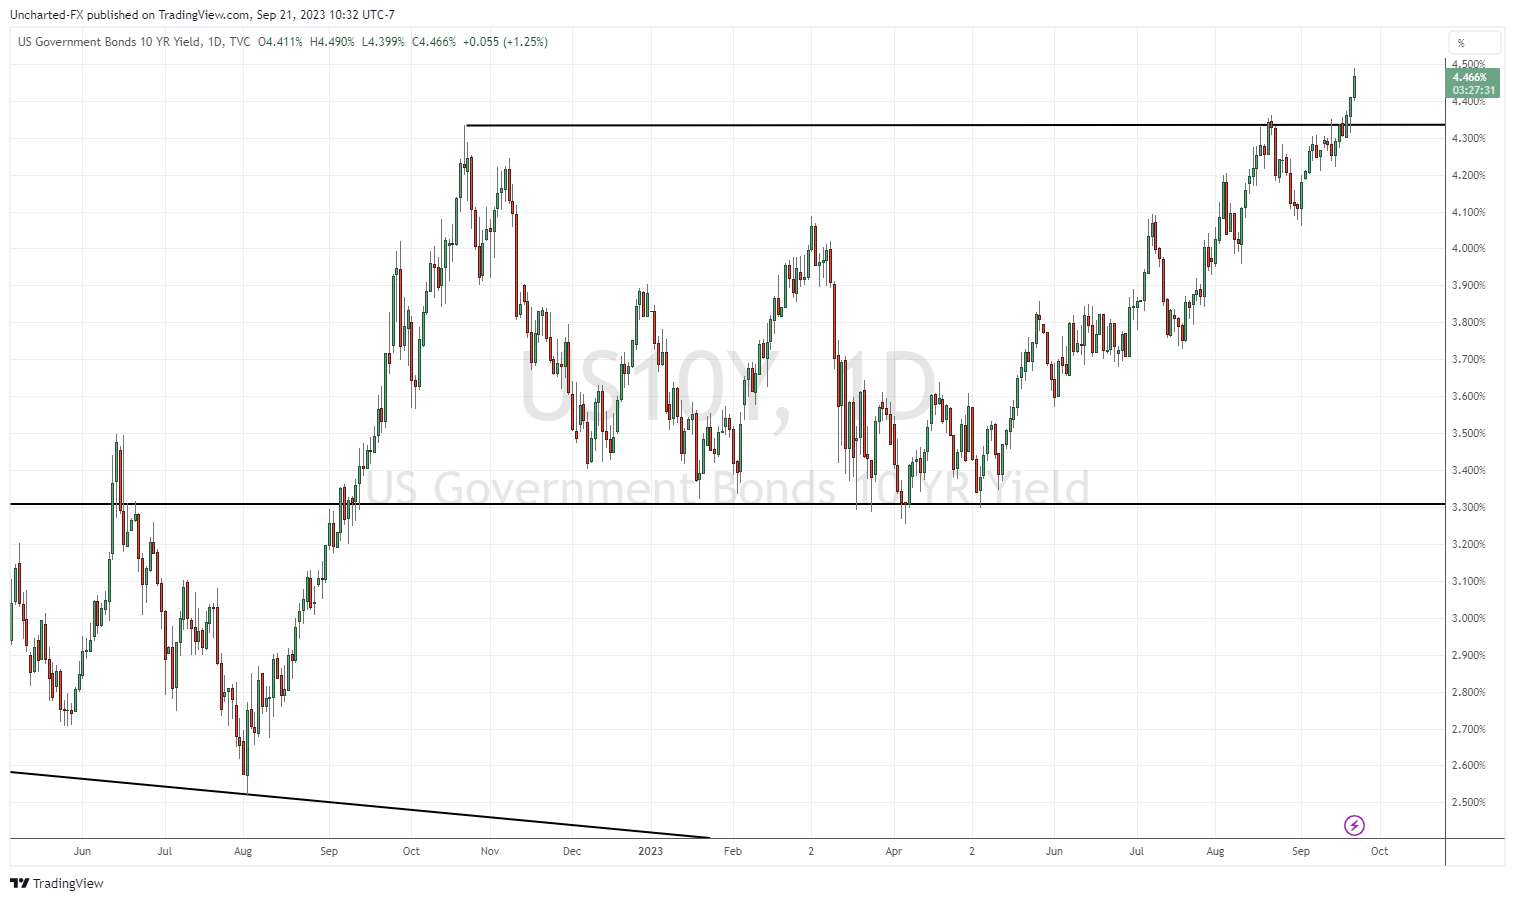
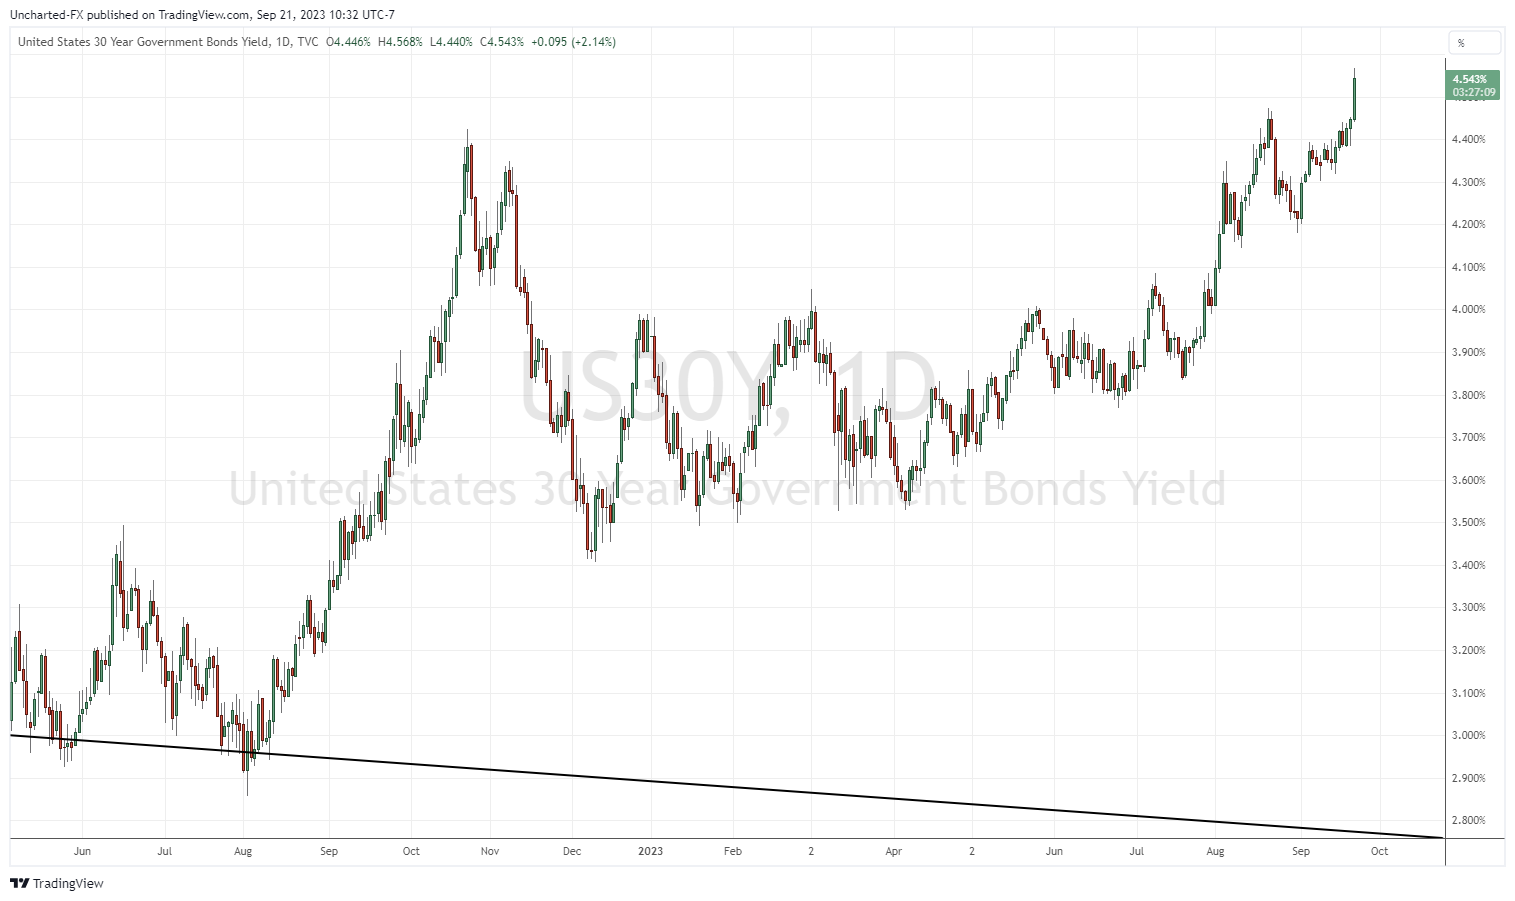
And this is big. Above are the charts of the 2 year yield, the 10 year yield, and the 30 year yield. We are seeing breakouts on all ends of the yield curve. This is hinting at higher rates, and most definitely mortgages and other borrowing costs are rising due to this breakout. The key is seeing if we continue the momentum. Watch for a retest of the breakout zone. If yields bounce and continue higher, it would not be a good sign for the stock market.
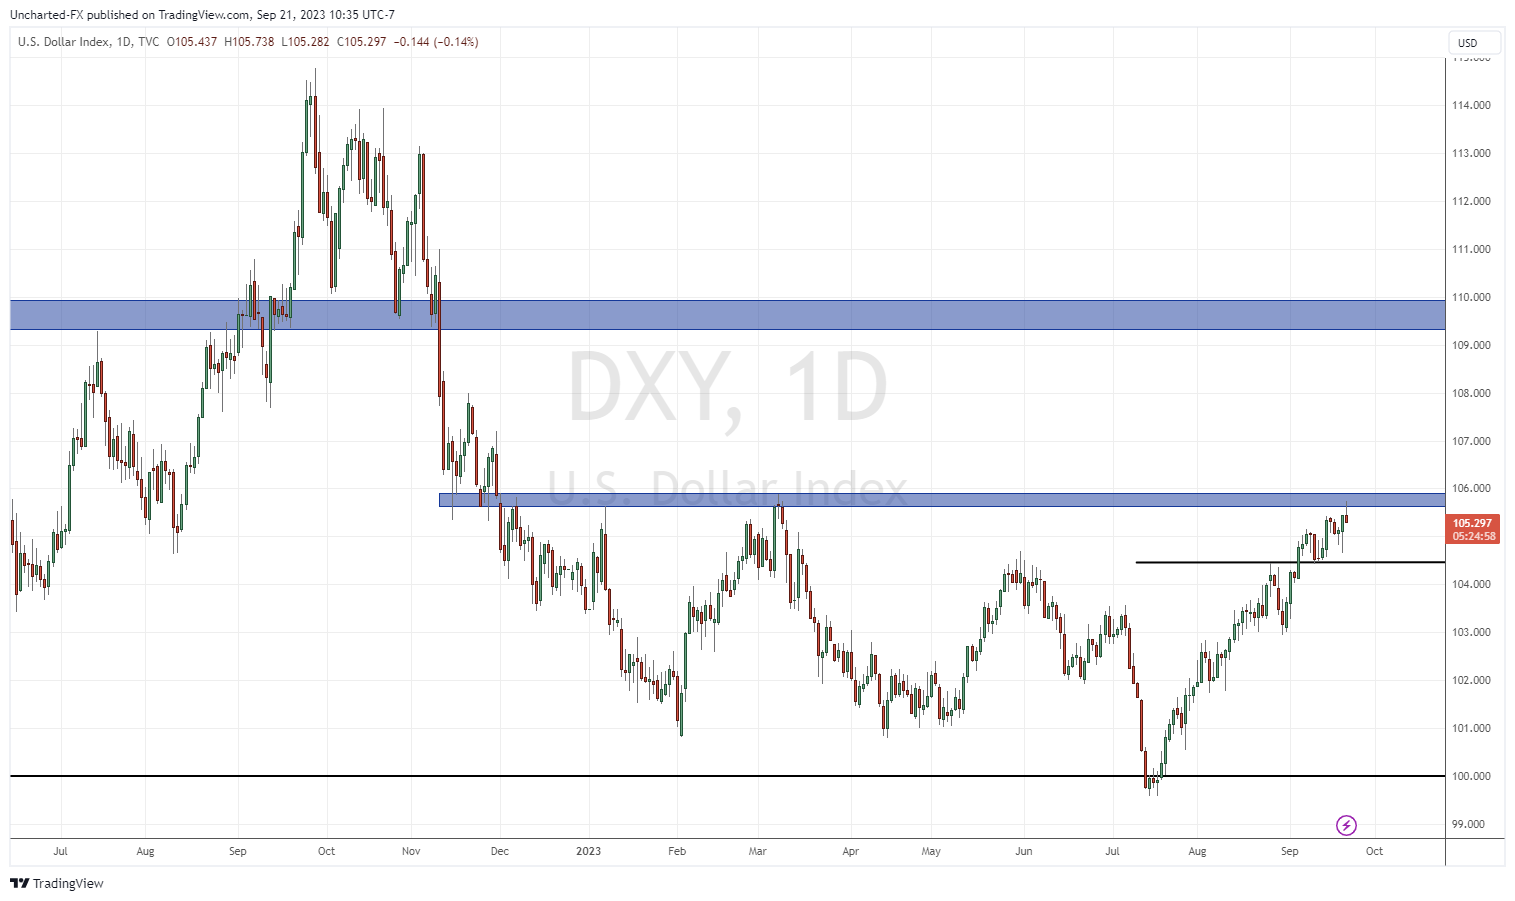
The US Dollar also closed green post Fed. The uptrend is technically in play as long as the DXY remains above 104.50. As you can see, the Dollar is testing a key resistance level. A breakout would be bullish and set us up for a move towards 110. Could a more hawkish Fed or markets anticipating more rate hikes be the catalyst? Or will it be a fear trade with markets falling and money running into the safety of cash?
Let’s end with the stock markets, and things are playing out as I have mentioned in past Market Moment articles.
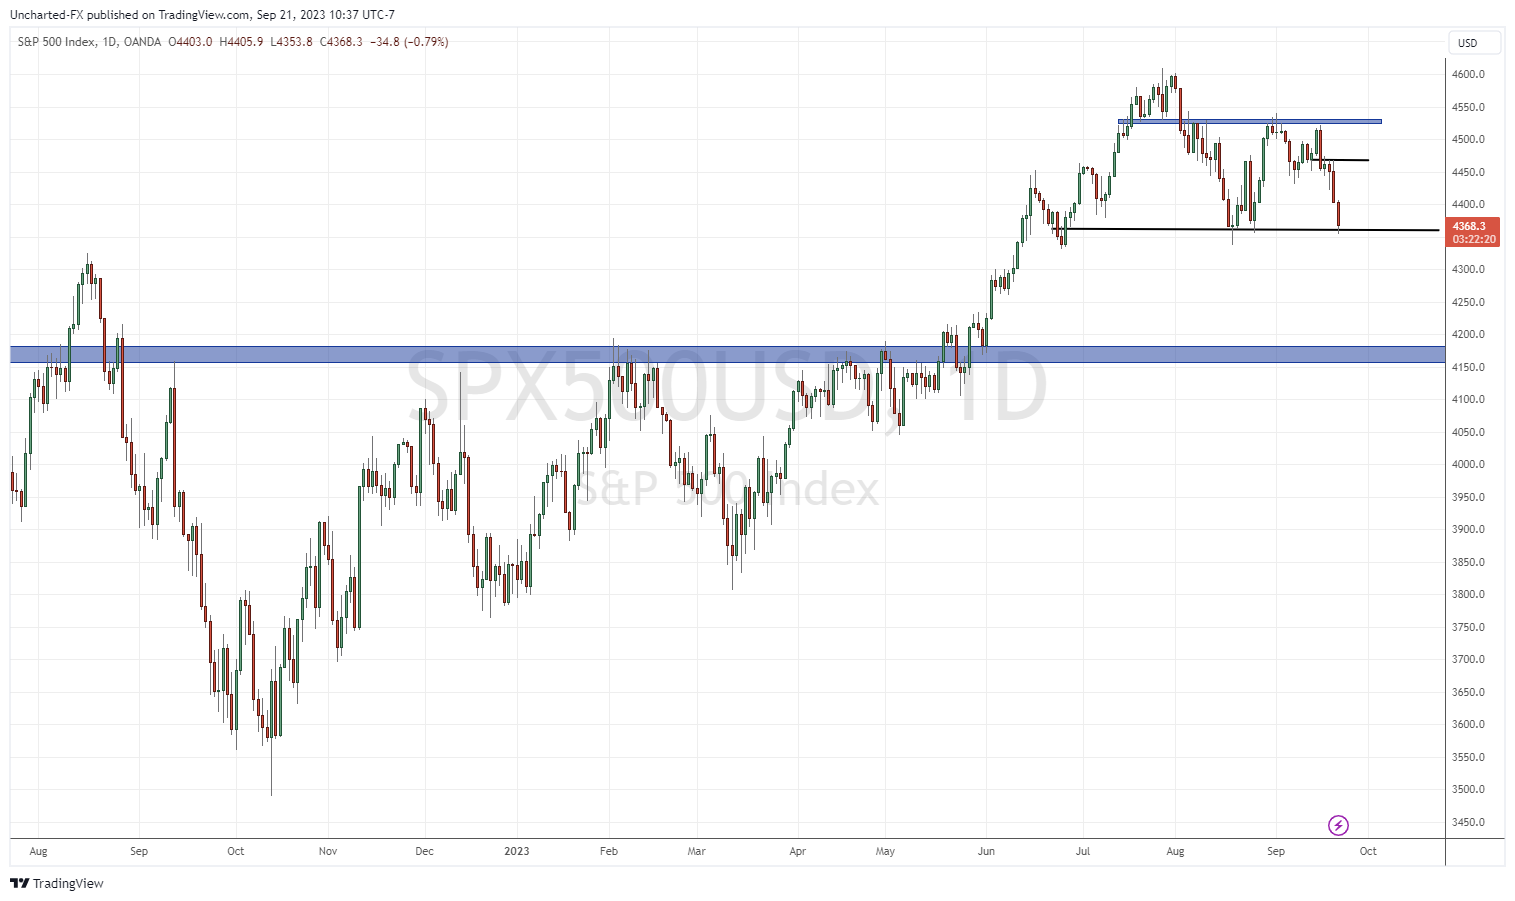
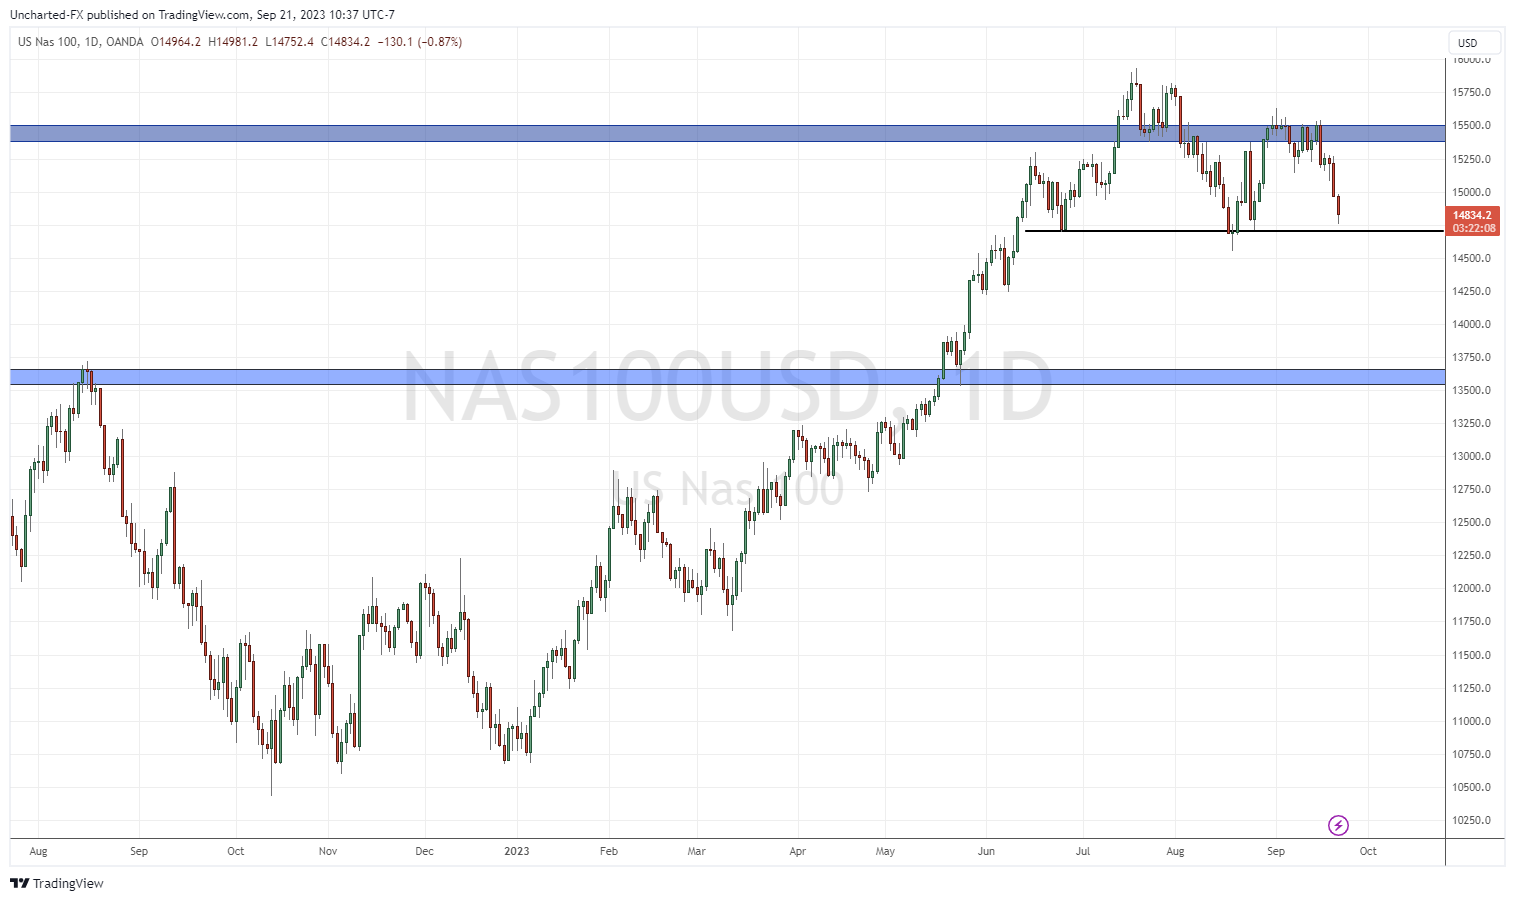
Above are the charts of the S&P 500 and the Nasdaq. The key takeaway is that our major resistance zones highlighted in blue have held. Sellers have stepped in and bulls will need to take these levels out to turn things around.
But look at the broader picture. I spy a famous reversal pattern known as the head and shoulders playing out.

This is a major reversal pattern and currently, the neckline or support, is being tested. We are seeing buyers step in as seen by the wick on today’s daily candle. But it is still too early to say the buyers will turn the ship around here.
This bounce could just be a dead cat bounce with sellers looking to enter on the bounce.
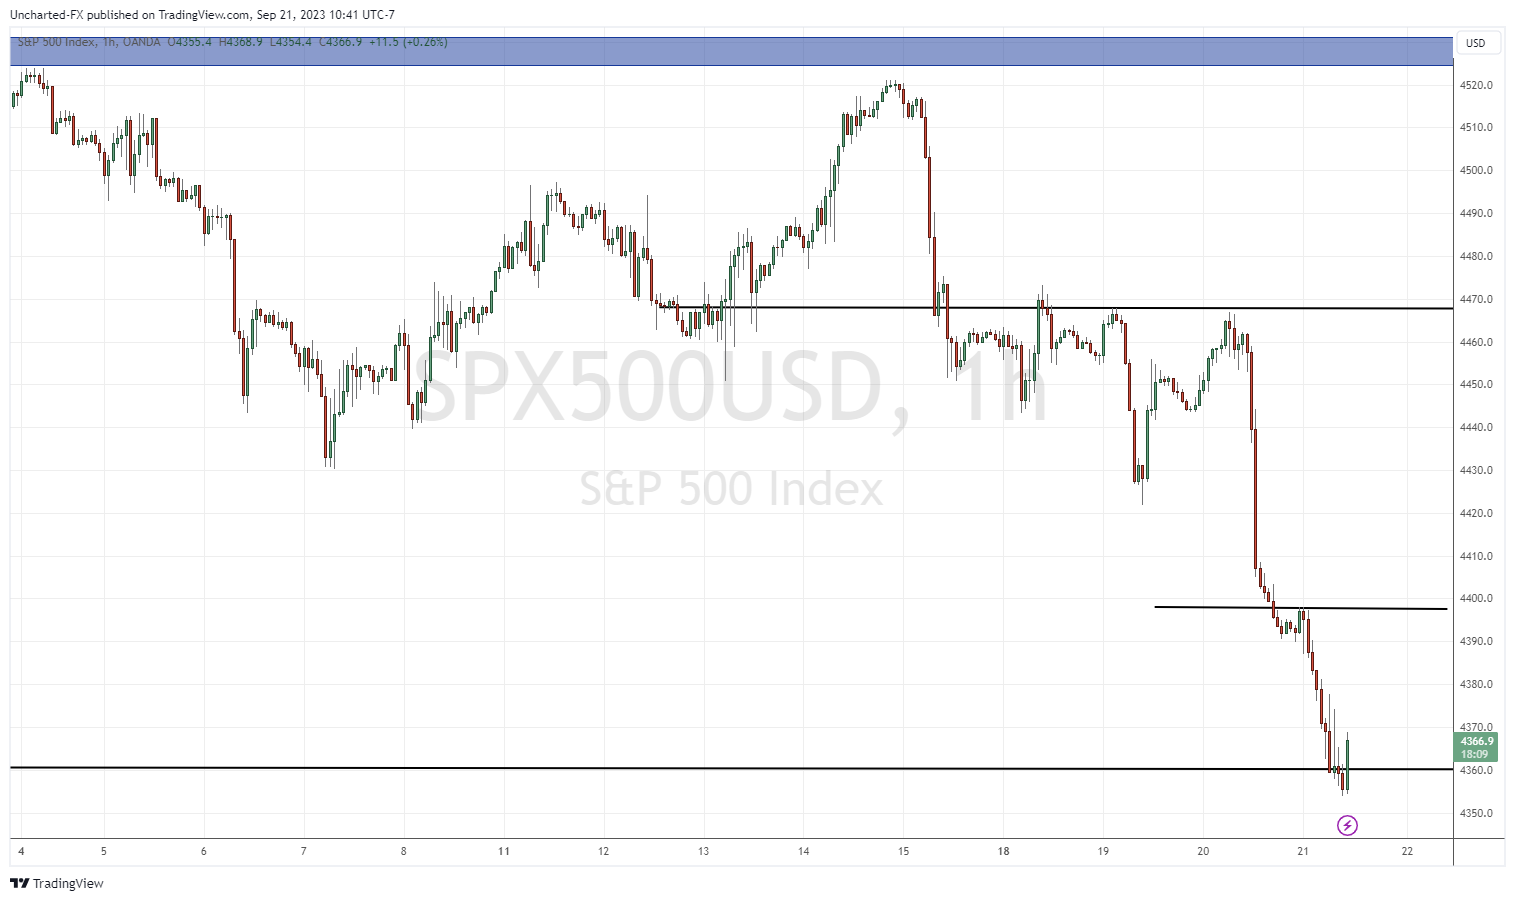
The way I would play any chance of a reversal would be watching the price action on the intraday 1 hour chart. If bulls can take price over the previous lower high at 4400, then it would be a good sign that the bulls are beating out the bears who are trying to get a good entry.
Going forward, if the S&P 500 and the Nasdaq do close below the necklines on the daily chart, it would trigger the reversals and begin a new downtrend on stock markets.
Leave a Reply