Oil markets are making headlines, but if you have been a reader of Equity Guru, then you were given the heads up back in late July 2023. My outlook and technical analysis play by play was given in subsequent articles and chart attack videos. Our first target has been hit, and prices are pulling back as expected. But this remains a correction in an uptrend, and now $100 is the next major psychological level.
But Wall Street is even more bullish on oil. In recent days, JPMorgan’s head of EMEA energy equity research, Christyan Malek, gave a price target of $150 for Brent Crude by 2026. The catalysts for this move include capacity shocks, an energy supercycle, and efforts to push the world away from fossil fuels.
The oil markets surged in early September on news that OPEC+ members Saudi Arabia and Russia extended their production cuts until the end of the year. We are talking 1,000,000 barrels per day (bpd) for the Saudis and Russian export cuts of 300,000 bpd. Both OPEC+ members claim this is to maintain the stability and balance in the oil markets.
Just last week, the Russians announced an indefinite ban on diesel exports to stabilize fuel prices domestically. This risks disrupting fuel supplies ahead of Winter and threatens to exacerbate global shortages. Lovely. Oil prices rose on the news.
So let’s put two and two together. Increased and/or stable demand for oil paired up with supply restrictions. That spells higher oil prices.
“Put your seatbelts on. It’s going to be a very volatile supercycle,” Malek told Bloomberg on Friday, as the analyst warned about OPEC’s production cuts and a lack of investment in new oil production.
JPMorgan now sees the global supply and demand imbalance at 1.1 million bpd in 2025, but growing to a 7.1 million bpd deficit in 2030 as robust demand continues to butt up against limited supply.
In the end, it will be the consumer feeling the pinch. Energy makes up a large portion of consumer spending. Consumers will feel the pinch at the pumps. Higher oil prices mean higher transportation costs. This results in businesses having to increase prices to cope with higher costs which are then passed onto the consumer. Higher inflation anyone?
And this topic is relevant given the rise in oil prices AND where analysts think oil prices are heading. Higher oil prices means an increased chance of an inflation surprise… which translates to a hawkish Federal Reserve and other central banks.

US CPI is beginning to turn again and heading in the opposite direction of the Fed’s 2% inflation threshold level. We know that the Fed is expecting higher interest rates for longer. However, if oil continues to rise and we do not see a decline in retail sales data, GDP, and the labor market, the Fed may keep the foot on the accelerator. Hence why we are seeing interesting action on the bond markets AND the stock markets are pretty much ready to trigger major reversal patterns.
Now let’s take a look at some charts!
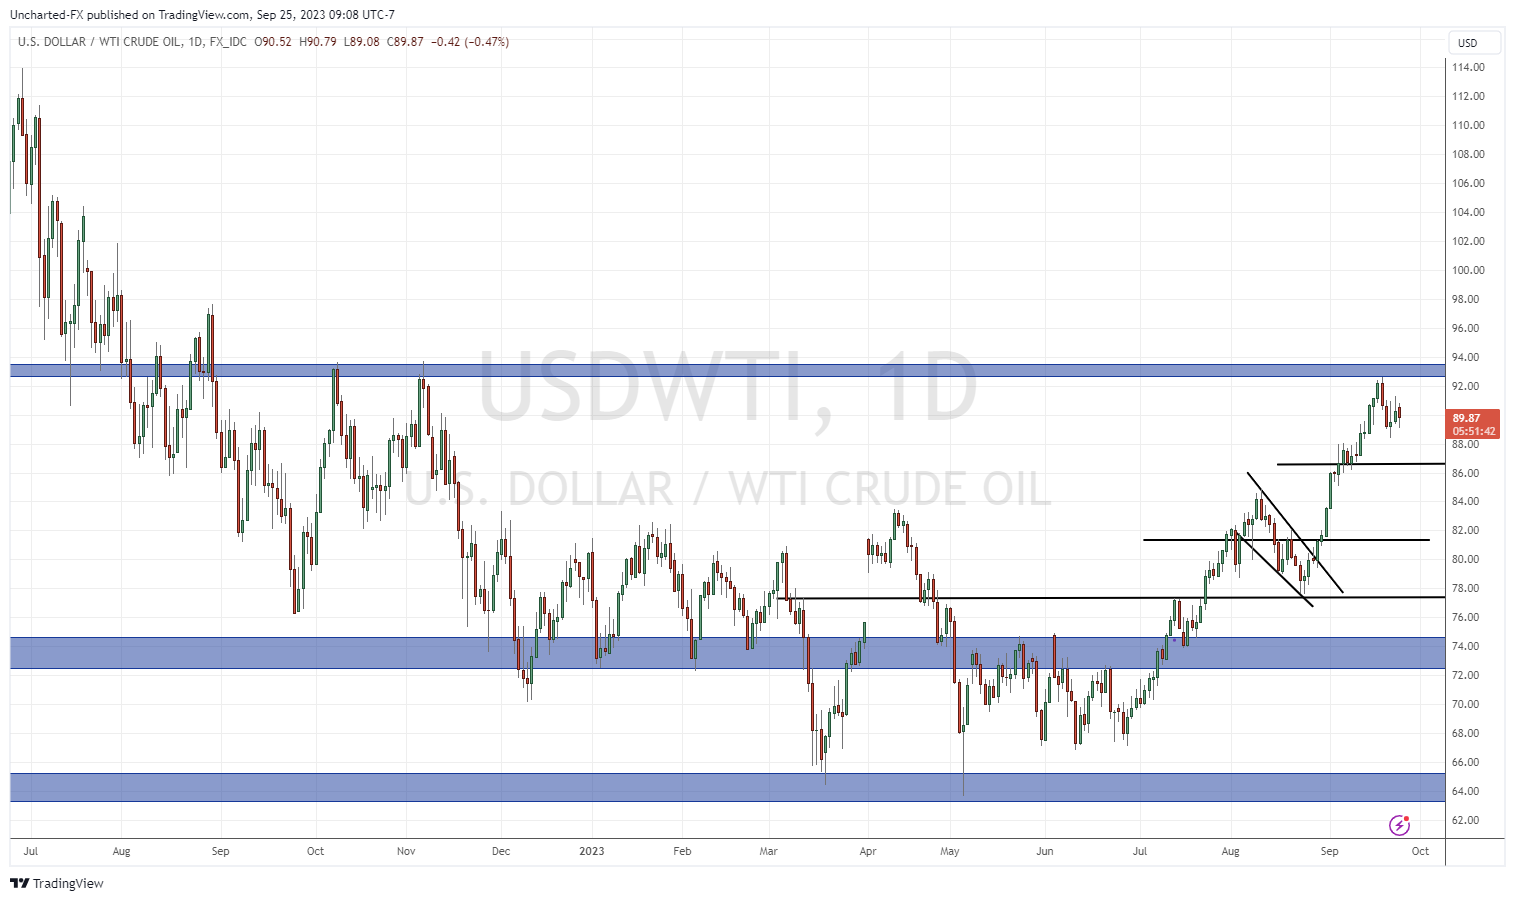
West Texas hit its highest level in 2023 when it hit our resistance zone, and first target, around $92.50.
Since then, the price has been falling. But once again, this move lower is technically a correction in an uptrend. This means oil can break above $92.50 and continue its uptrend onto the $100 level. Where would things take a turn? Note the line I have drawn at $86.60. This is the current higher low in this uptrend. Which means West Texas oil remains in an uptrend as long as it stays above this price level. If we get a close below this zone, then oil would fall further down to the $82 level and we would have to reassess the uptrend momentum.
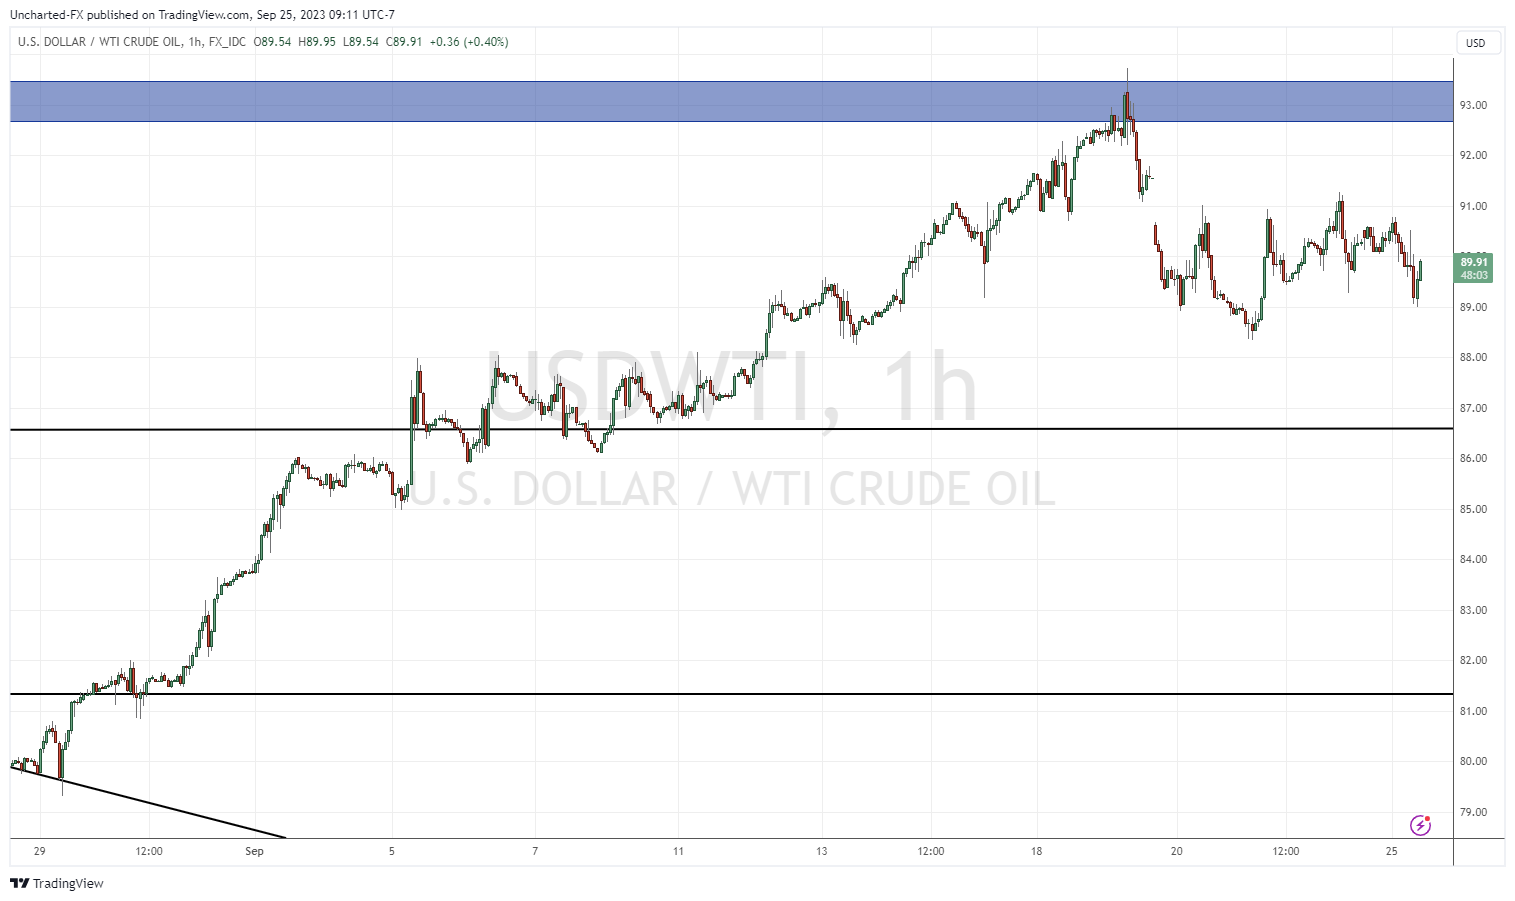
On the intraday 1 hour chart, you can see that a range has developed. Traders should await a break. We either close above $91.20 which would mean a retest of $92.50, or we close below $88.50, which would mean the corrective phase is still not over.
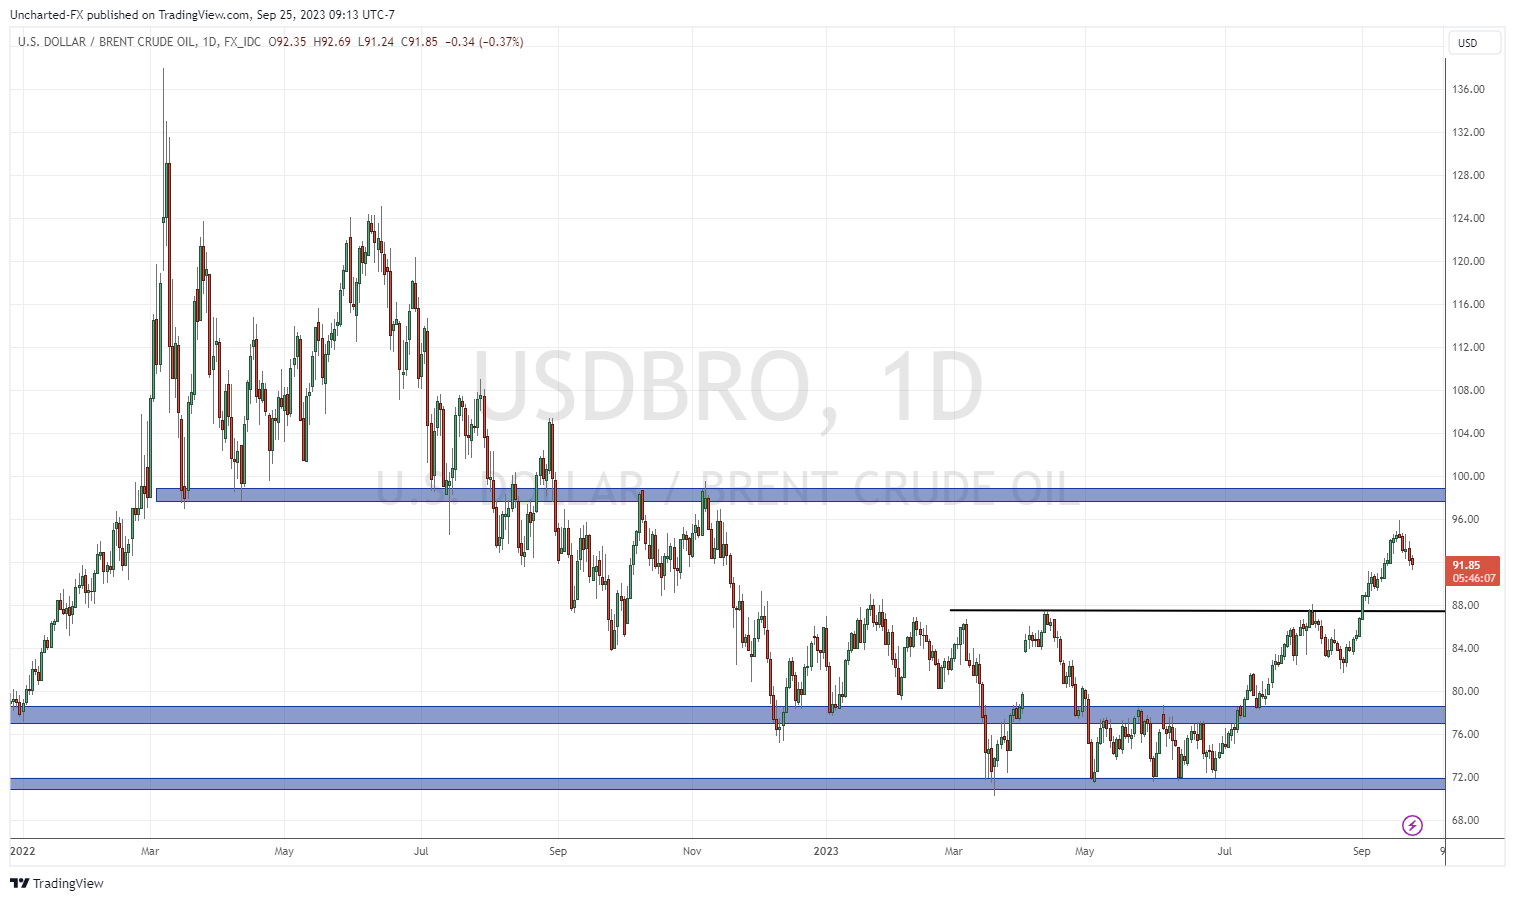
The technicals are pretty much the same with Brent Crude. The higher low comes in at $89.60, and resistance around the $100 zone. A break above $100 would take us to $108. Recall that JPMorgan has given a target of $150 by 2026. At time of writing, Brent Crude is trading around $91.85.
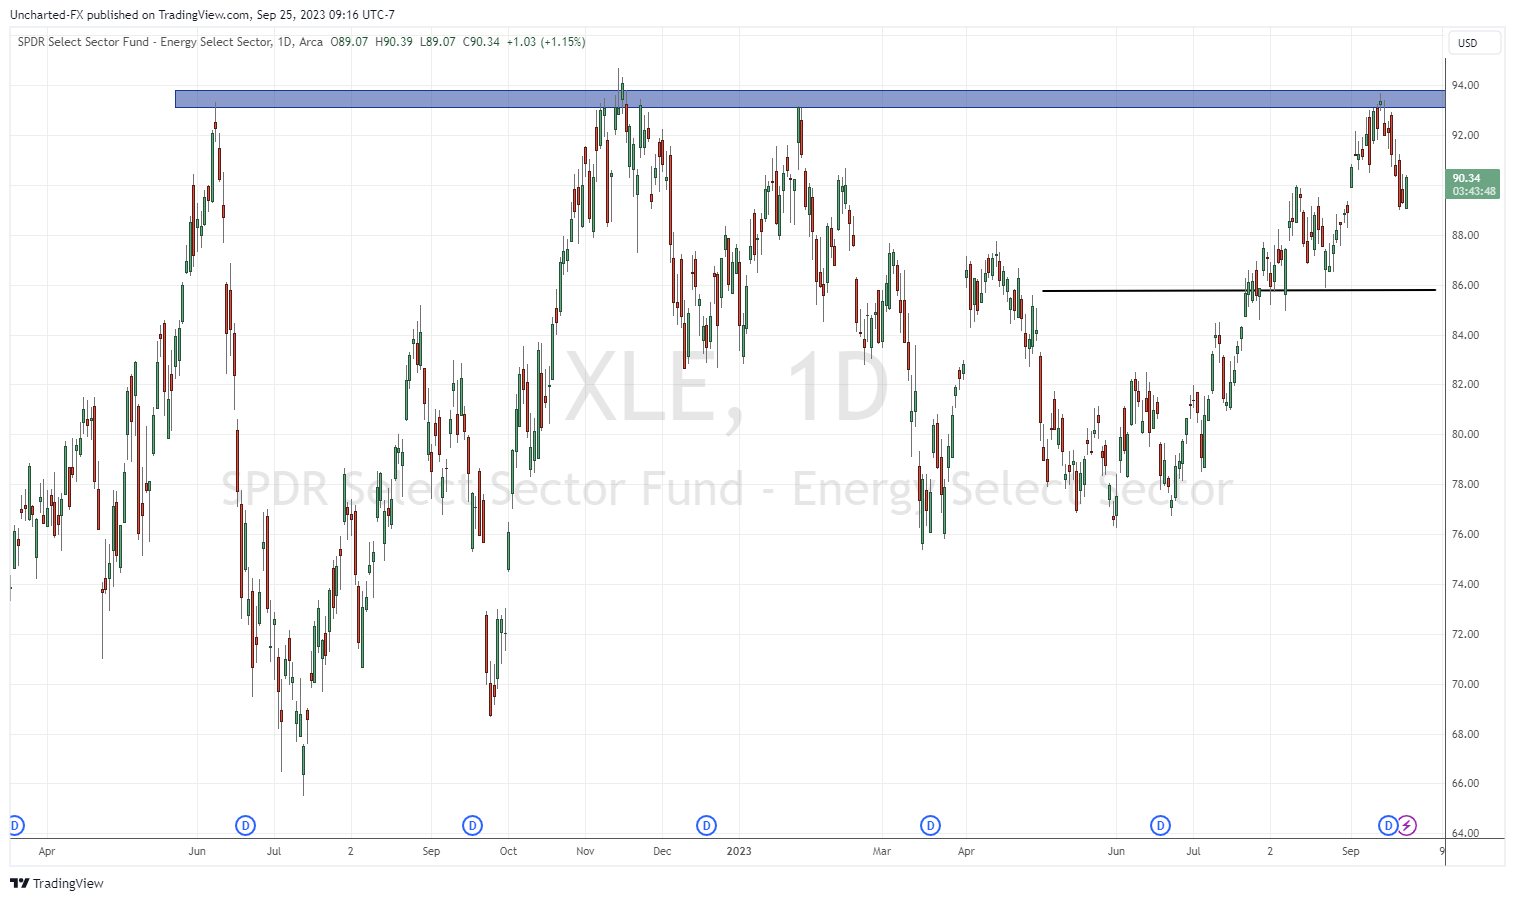
Some traders and investors may prefer trading ETFs to profit off of this move in oil. XLE just tested a key resistance zone and is also in its corrective phase. The higher low comes in at $86, but traders should await a breakout above the $94 zone. The next resistance comes in at record highs around $100.
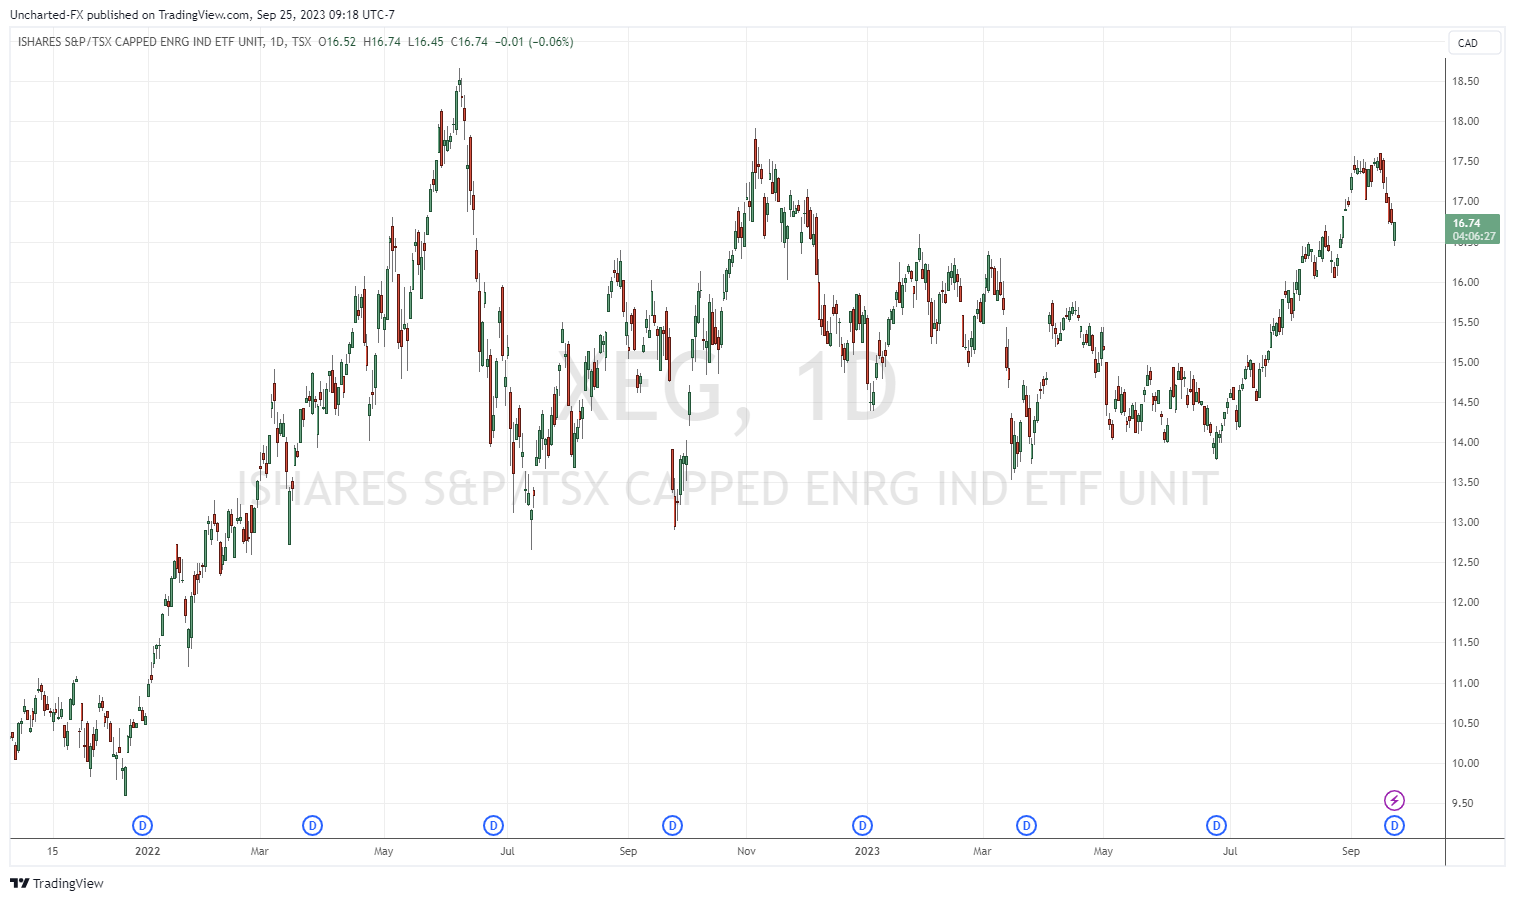
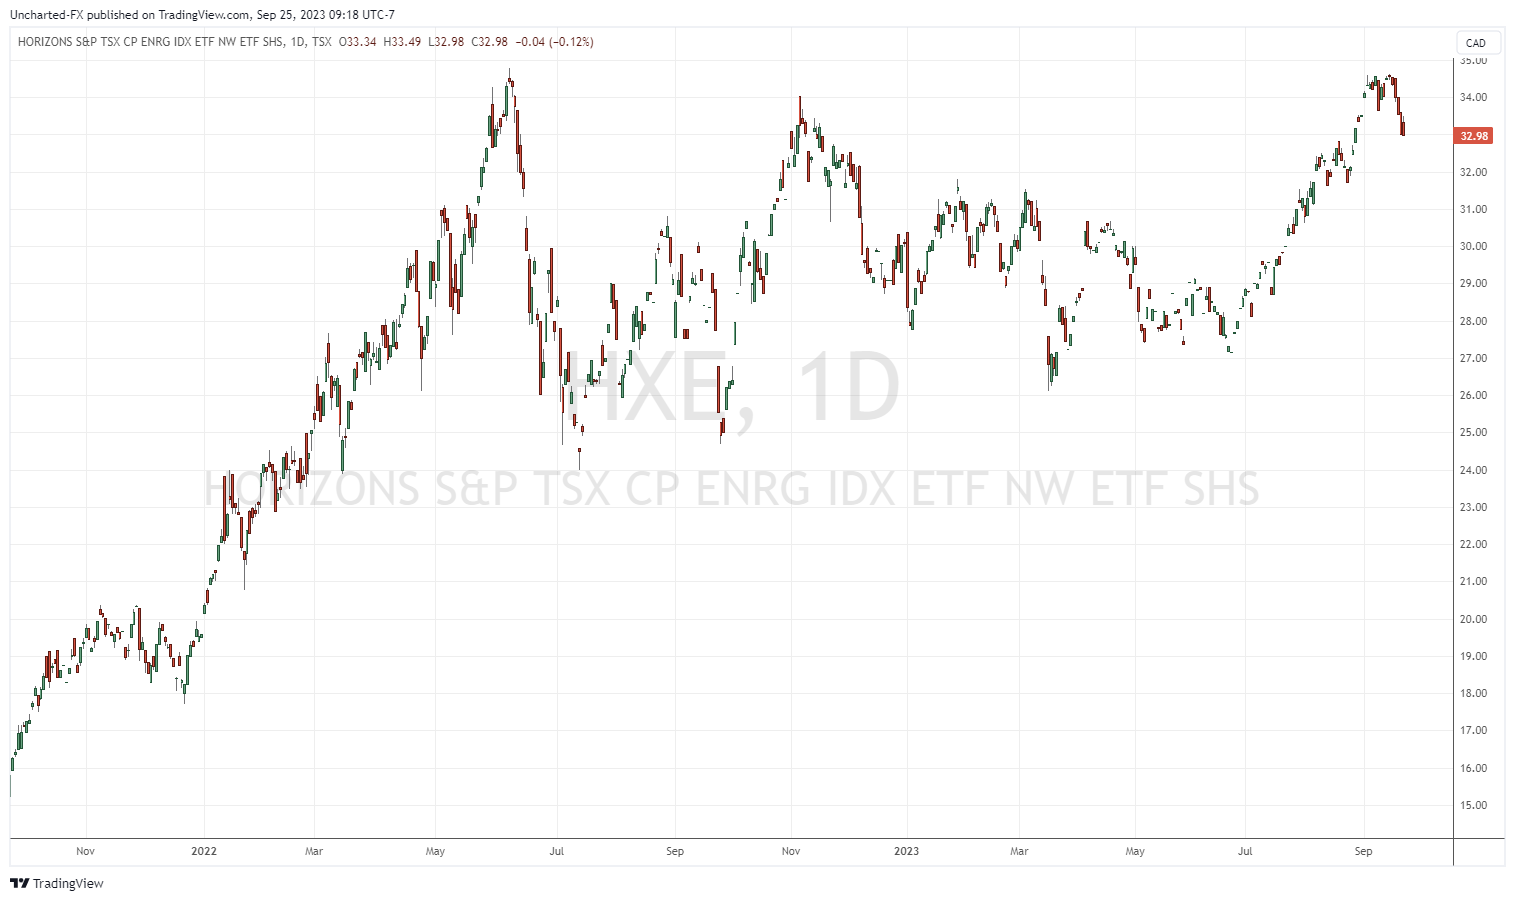
Canadians may prefer XEG or HXE which both share the same market structure as XLE.
Speaking about Canada, oil and energy plays a crucial role in the Canadian economy and the Canadian stock market.
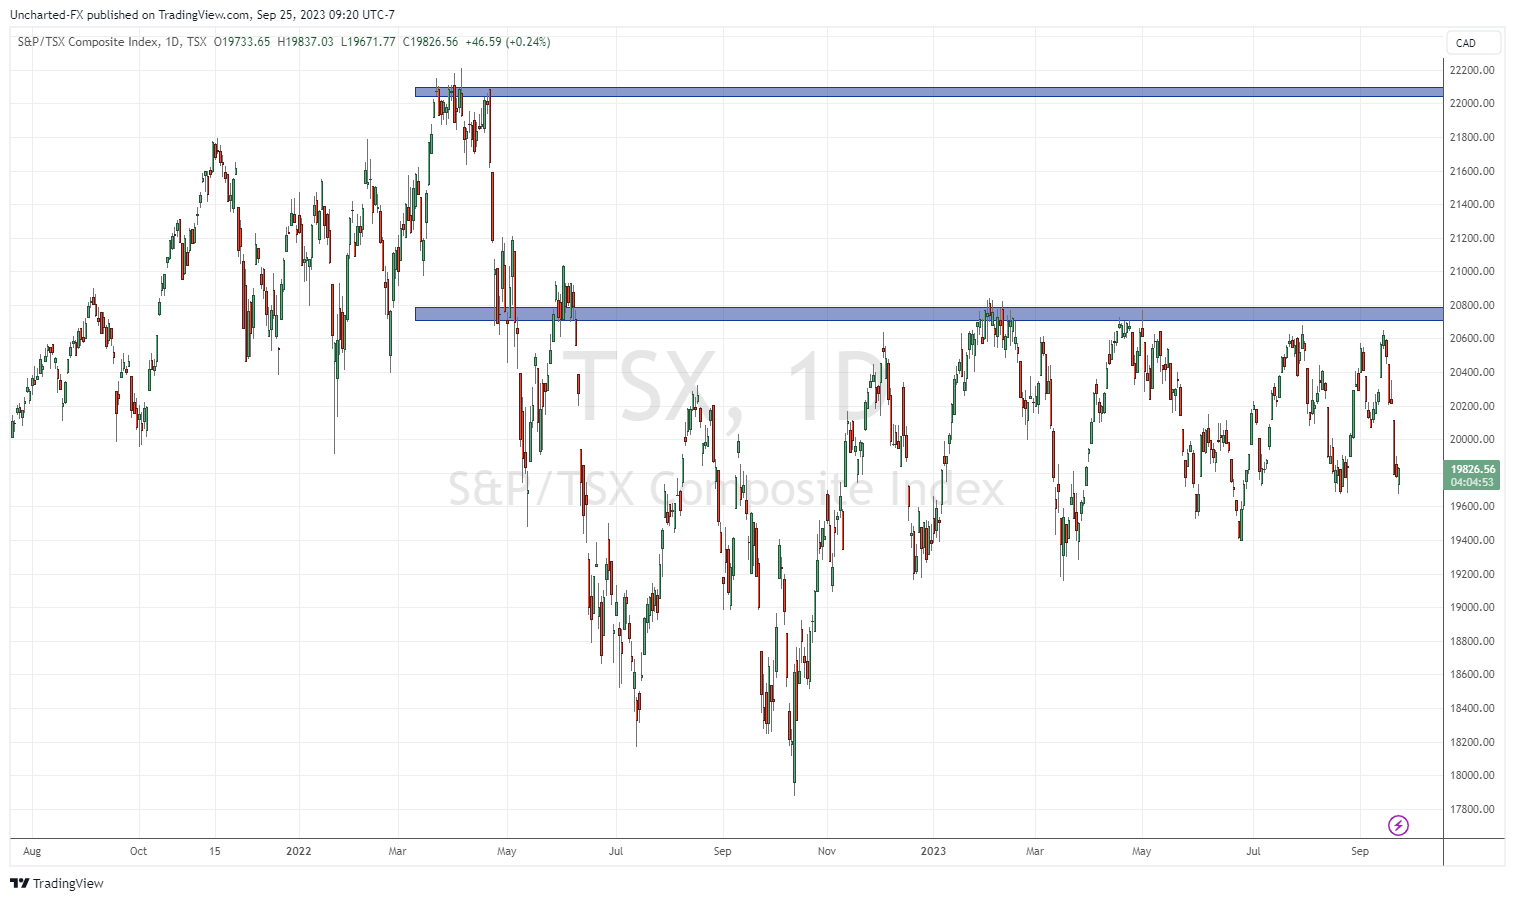
The TSX has been in a range but if oil prices rise and oil stocks do well, the TSX should perform better since the majority of the stocks are energy stocks. Although we must be careful with a potential overall risk off sentiment which could impact all stock markets.
For those looking to make a higher return playing rising oil prices, smaller and medium cap oil companies listed on the TSX are worth looking at. These stocks tend to move with the price of oil.
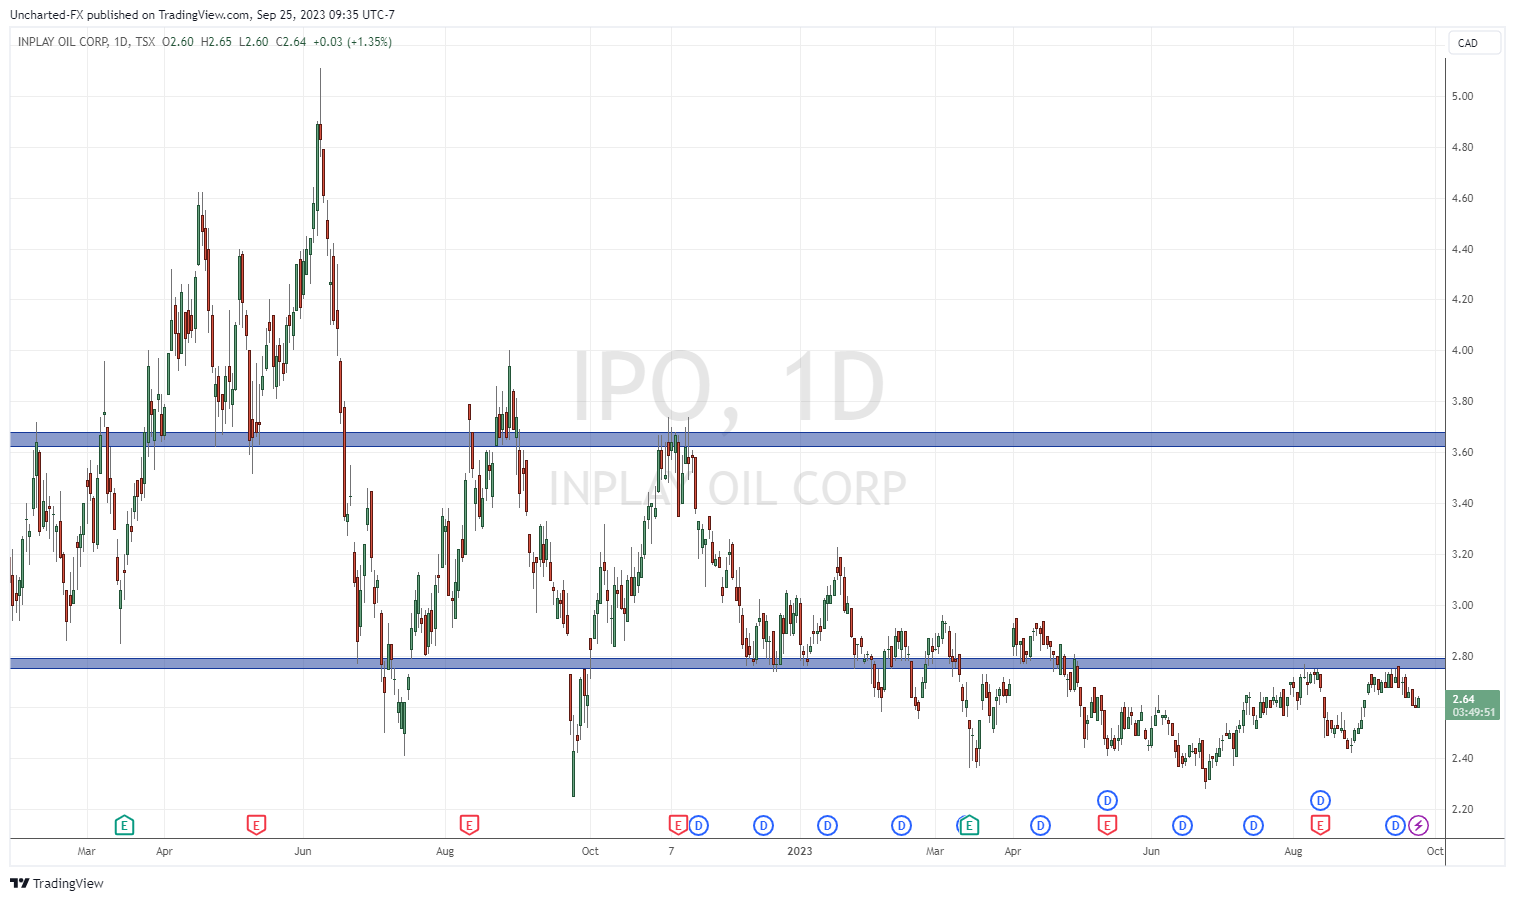
InPlay Oil (IPO.TO) is a Company we like as they have acquired good oil and gas properties in Alberta and have generated enough revenue where they can pay a dividend. For more information on the core story and tale of the tape, be sure to check out Chris Parry’s recent article on InPlay Oil.
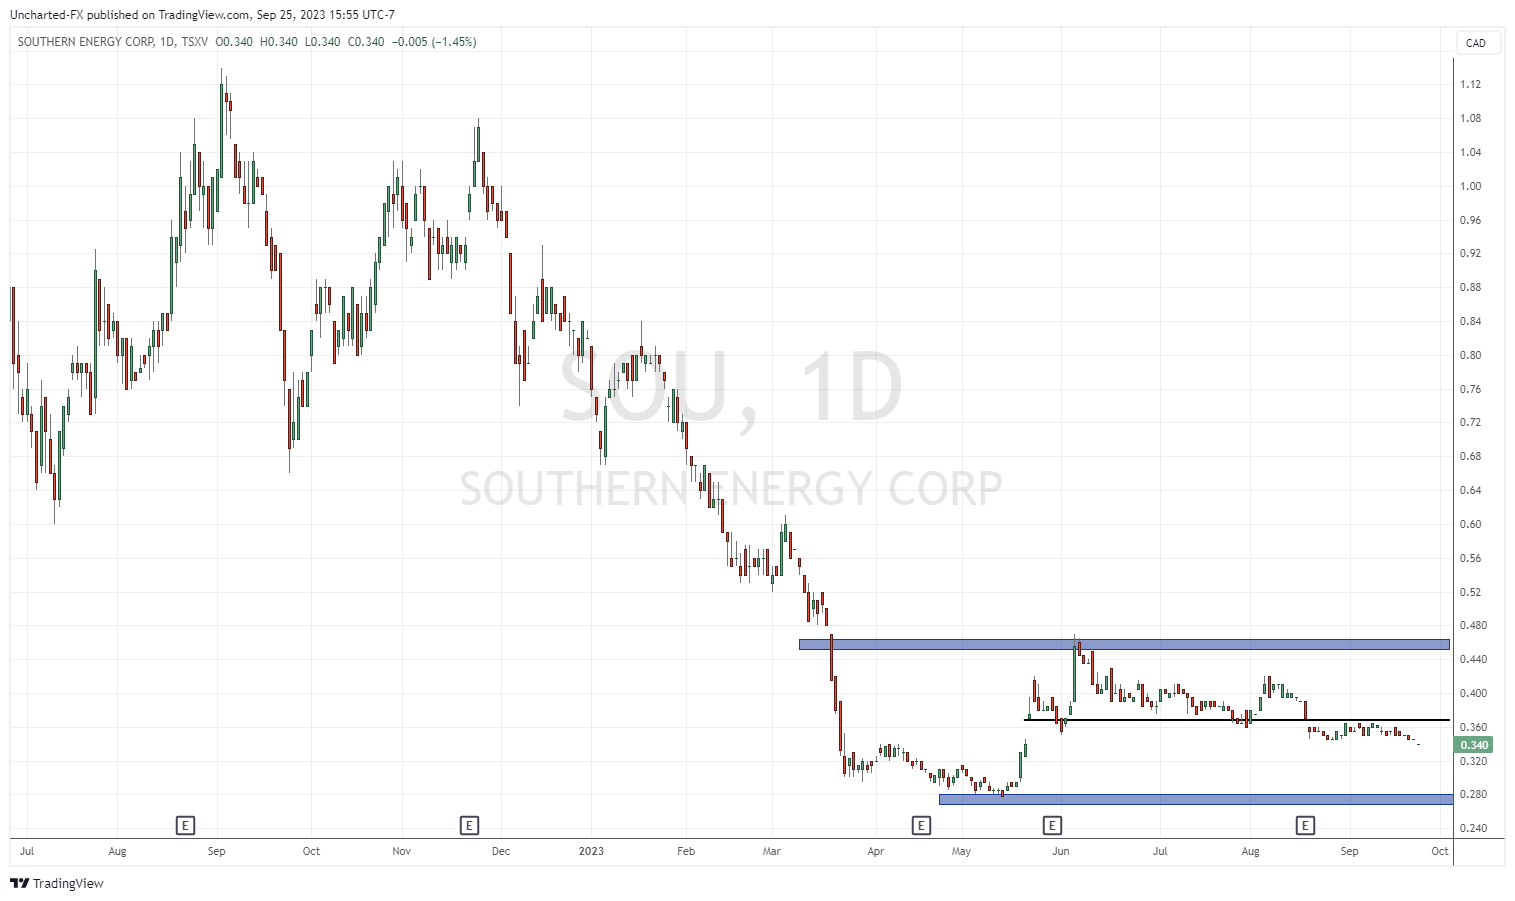
Southern Energy (SOU.V) is a natural gas exploration and production company. Southern has a primary focus on acquiring and developing conventional natural gas and light oil resources in the southeast Gulf States of Mississippi, Louisiana, and East Texas. Its principal properties are Central Mississippi Assets that covers an area of approximately 31,000 acres containing oil and gas production at Gwinville, Mechanicsburg, Williamsburg and Mount Olive, and Mississippi.
Southern Energy has an interest in 220 net producing and 80 non-producing wells which are comprised of conventional, low-decline, long-life reserves in fields with abundant infrastructure, low operating costs and premium commodity pricing.
The stock has broken below a support level at $0.37 and is drifting lower. There is a chance it can drop down to the $0.28 zone. Bulls should ideally watch for a reversal and close back above $0.36. This is one of those stocks which may move on a natural gas seasonality play. My technical analysis on natural gas can be seen at the end of this article.
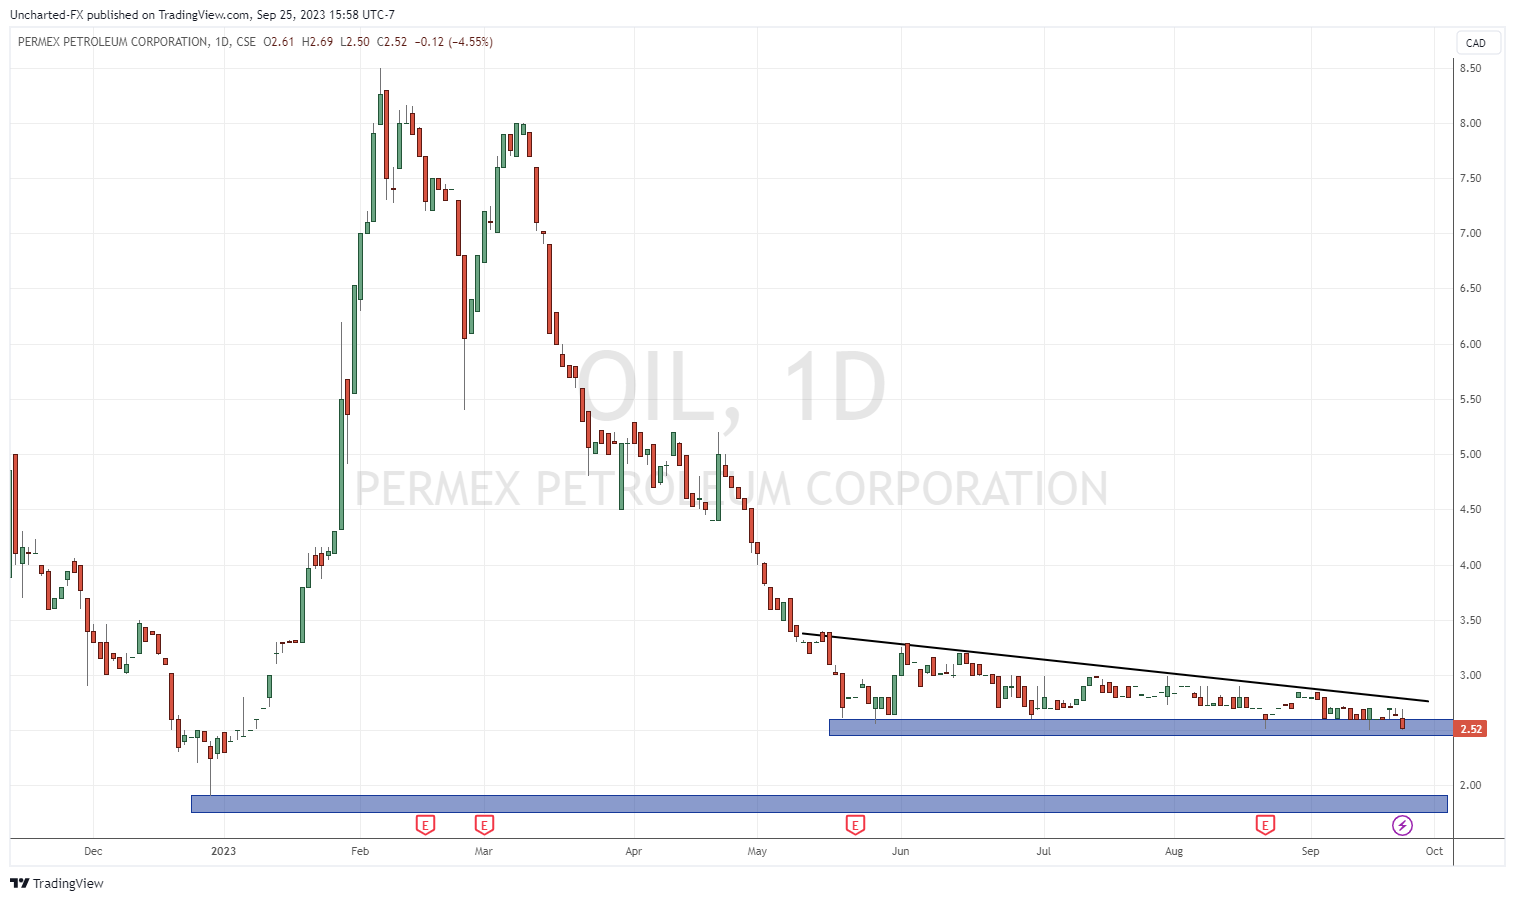
Permex Petroleum (OIL.C) is a junior oil and gas company that holds assets in the US, specifically in the States of New Mexico and Texas. The Company holds over 11,700 acres of oil and gas assets comprised of over 78 oil and gas wells. The Company also owns royalty interest in over 73 oil and natural gas wells.
The stock is at a very interesting zone here testing key support around the $2.50 zone. If this support breaks, the stock could fall down to the $2.00 zone. However, a coiling triangle pattern is also forming. This would be a bullish reversal trigger IF it plays out. Bulls would want to see a break and close above the downtrend line, or the $2.85 zone for confirmation.
And now, let’s take a look at the currency markets.
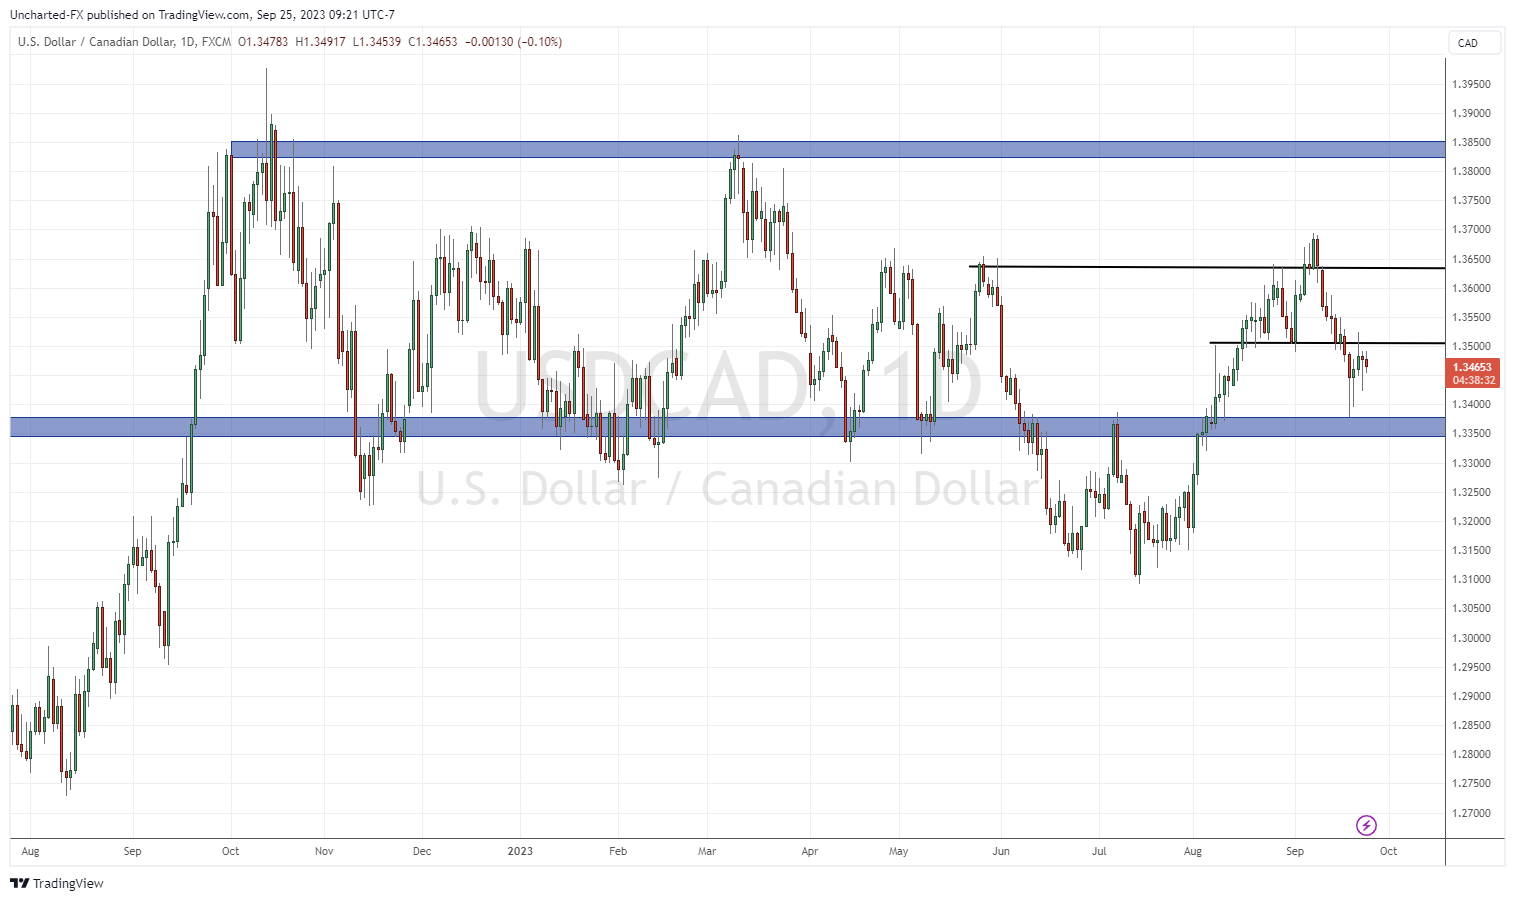
Perhaps a better way to play the oil move for traders would be through the currency markets. The Canadian Loonie, the Norwegian Krone and the Russian Ruble have the highest positive correlation with oil. I would recommend staying away from the Russian Ruble due to liquidity and other obvious reasons. But the Loonie is perhaps the currency that will benefit the most.
I have the chart of the USDCAD above. You can see that the Loonie has been appreciating against the US Dollar. We are not at a major support zone, but if USDCAD can break below $1.3350, then the Loonie will appreciate more.
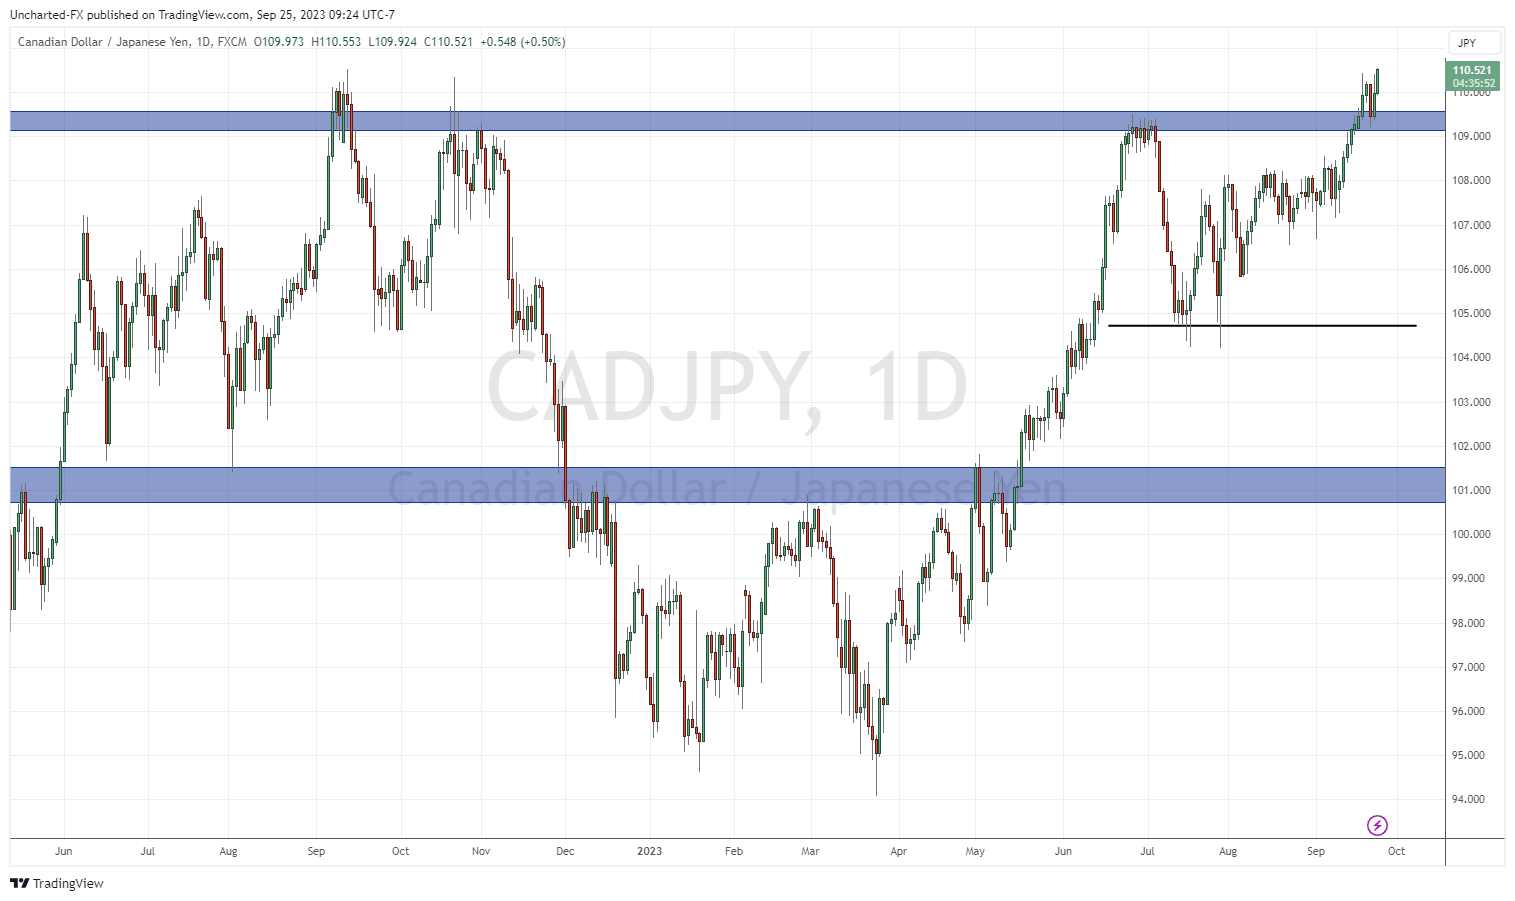
But the most preferred play on the currency market would be long CADJPY. The Loonie will appreciate on higher oil prices and the fact Canada has higher interest rates than Japan. The technicals are also pointing to higher prices. CADJPY has recently broken out and buyers have stepped in on the retest. There are plenty of targets to the upside with 120 being the next major zone.
The risk? That the Bank of Japan steps in to intervene to try and strengthen the Yen. But other than that, CADJPY is my preferred energy play through the forex market.
And now an added bonus:
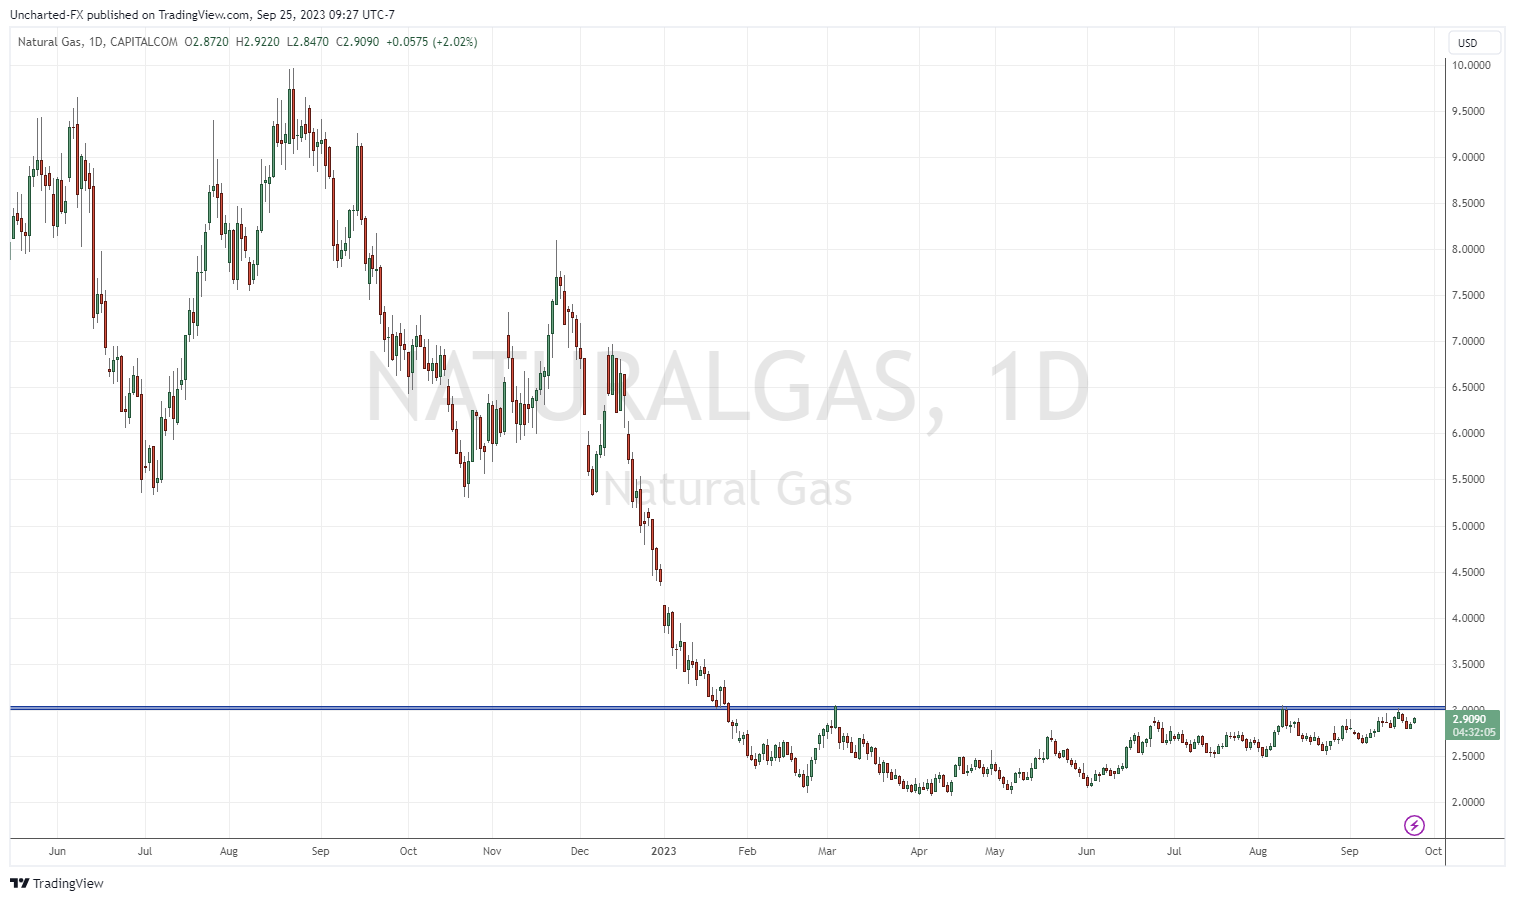
One of my favorite technical setups right now is on natural gas. We are clearly in a range, and every sell off at $3.00 is seeing bulls step in more and more. This can be seen by the interim higher lows. Once natural gas breaks and closes above $3.00, I expect a volatile move higher. $5.50 is the next resistance zone.
And the timing is right. Fall is about to begin and colder weather is coming. Seasonality means there will be higher demand for natural gas. Just a word of caution: natural gas is known as the widow maker trade given how volatile it is.
Leave a Reply