On October 3rd 2023, I published an article which caused some fright among metal bulls. I outlined how the technicals indicated that silver could go below $20 and gold below $1800. I outlined key technical levels which had been breached and thus led to sellers piling in. Here are the charts which I put up on that article:
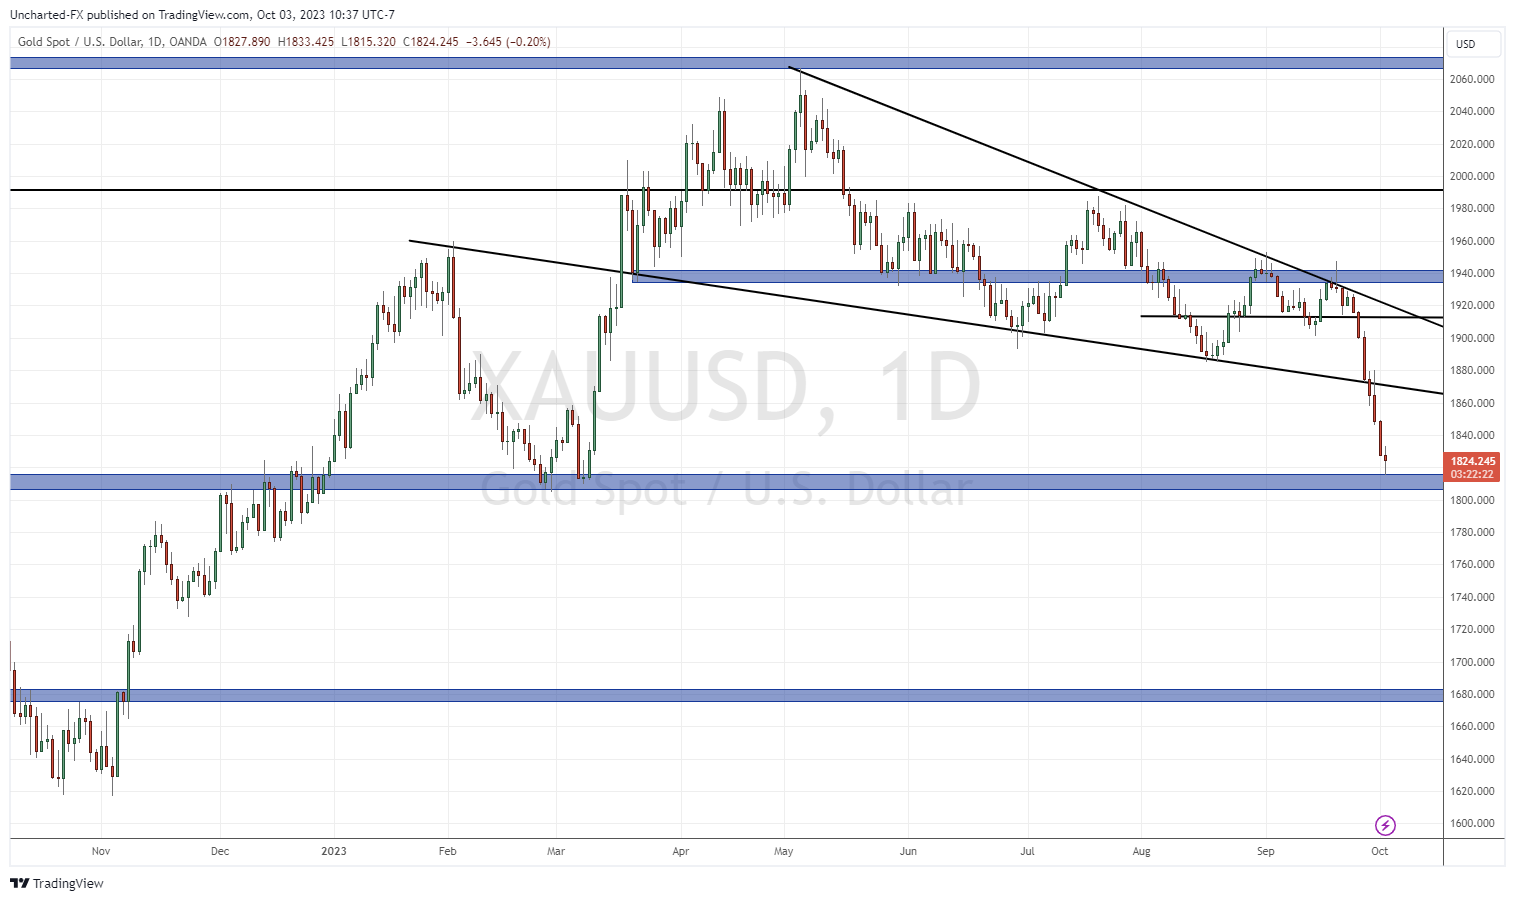
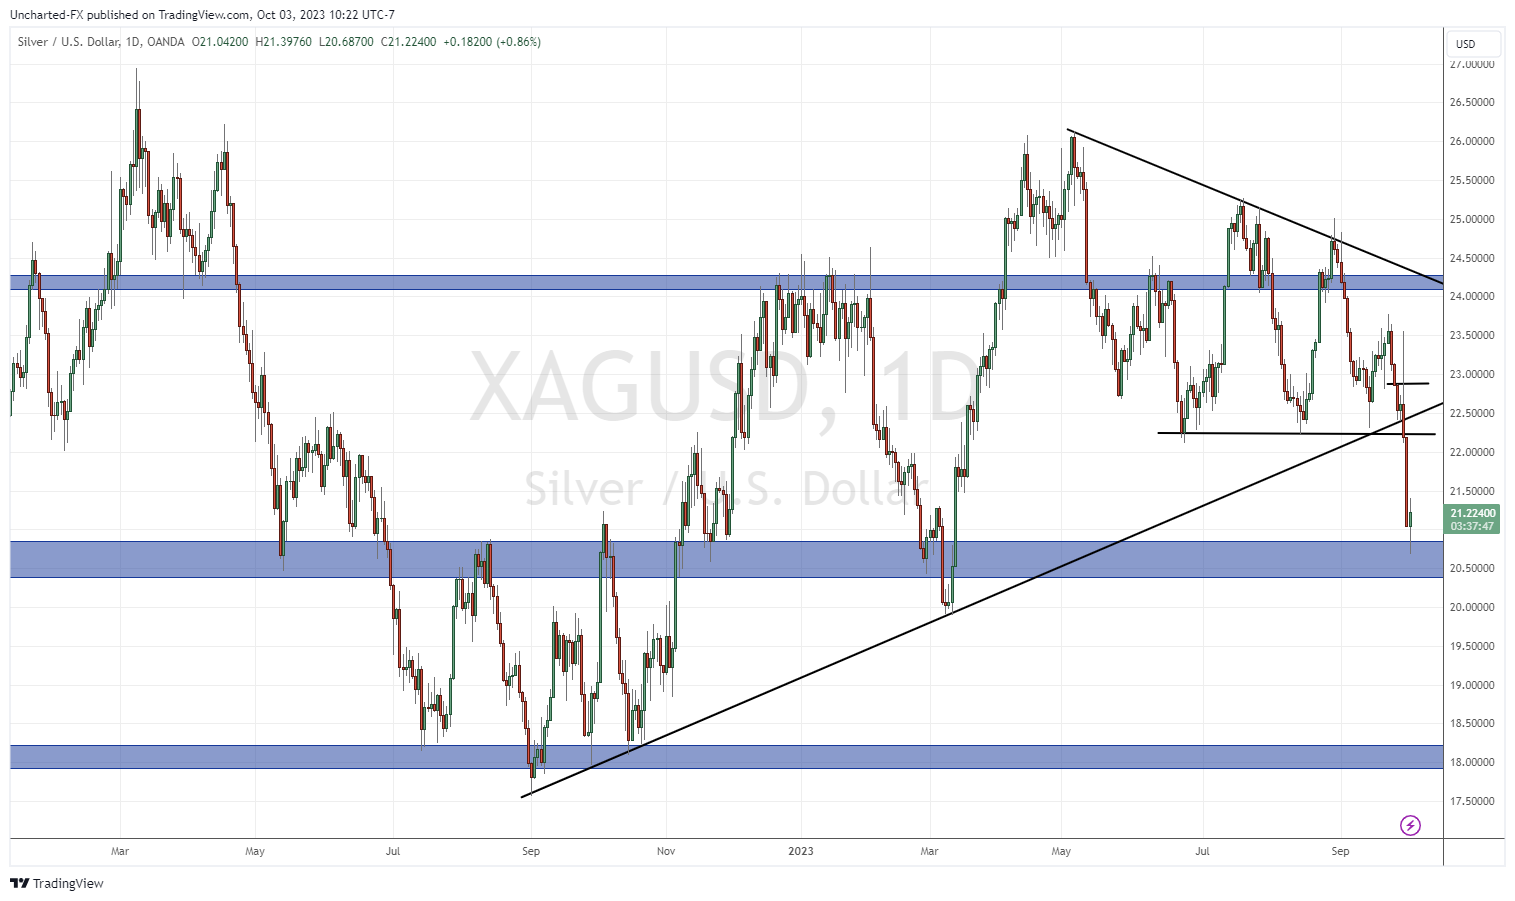
Both gold and silver had broken below major support and a major trendline. At the time of writing that article, both metals had reached our first support targets. I gave some intraday plays that gold and silver traders greatly benefited from if they are traders. However, for longer term swing traders/investors, I stated that the downtrend would still remain in play unless we saw a few things. These included either/or a major range developing at support, a close back above previous support and the trendline, a close above the previous lower high.
We did not get a major range at support, but we have now close back above the major trendlines. Trendlines which when broken led to both metals spilling.
Here is how gold and silver look now. Let’s start with gold:
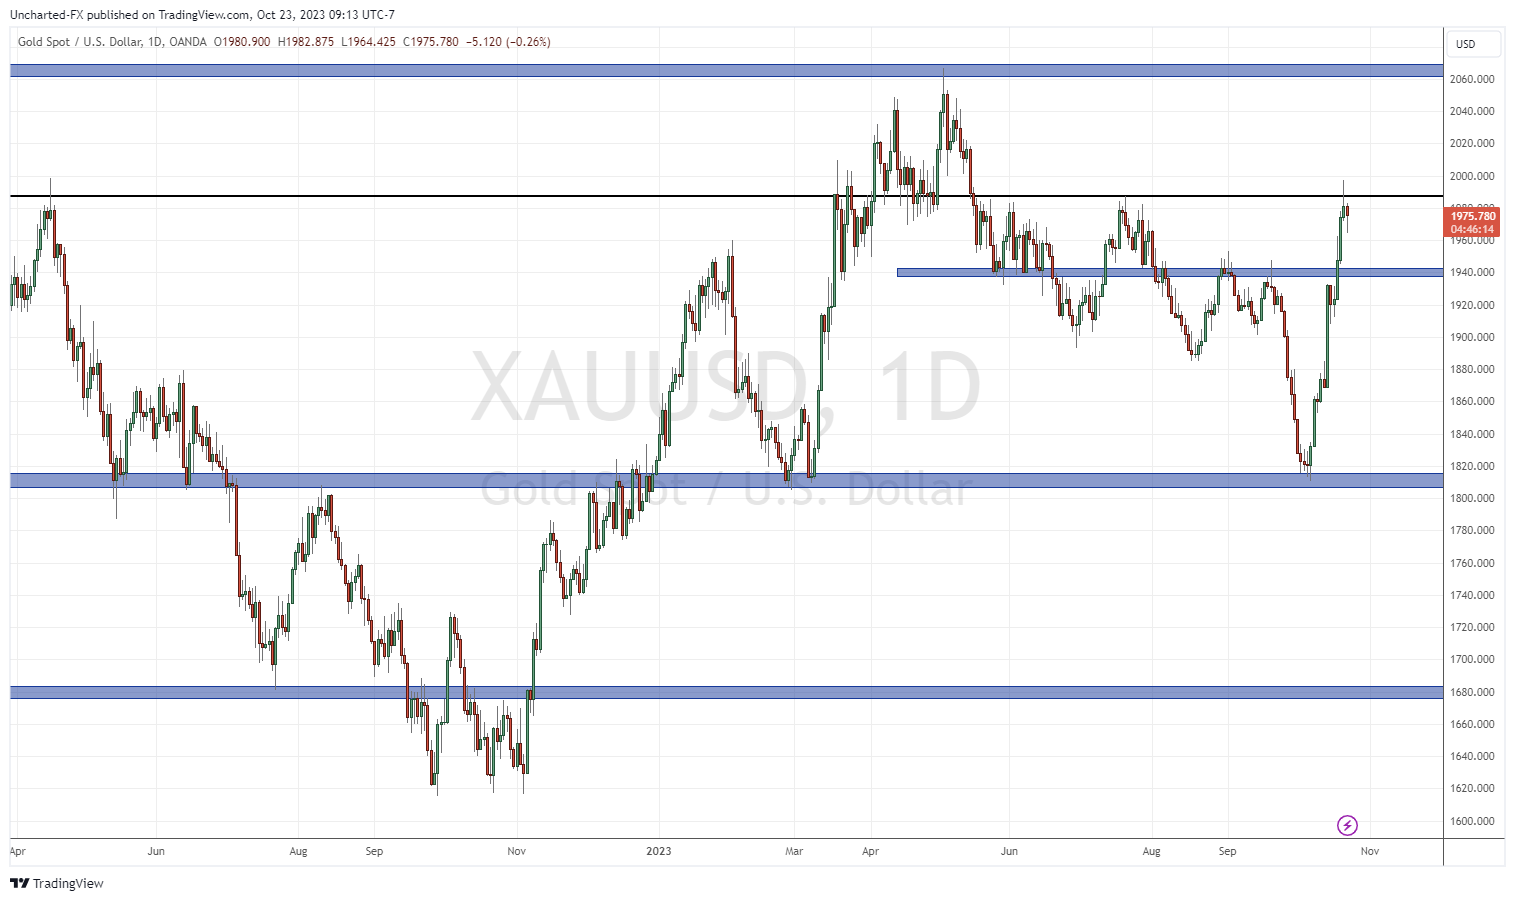
What a rally from the $1800 zone. From a technical perspective, the major lower high at $1940 has been broken. This is huge in terms of technicals. But as you can see, gold is now testing a ket resistance zone. The key zone of $2000, a major psychological zone. If gold can get a close above this price level, we are on the way to retest previous all time record highs… and perhaps the third test will be the charm to lead to a breakout.
For gold traders: gold has already made new all time record highs against the Australian Dollar, the New Zealand Dollar, the Japanese Yen and the Chinese Yuan.
So what now? As long as gold can remain above $1940, which may be retested on a pullback, gold has a real chance to continue this new uptrend which eventually leads to new all time record highs.
In terms of fundamentals, a lot of this price action has to do with geopolitics in the Middle East. I believe it is important to note that during Israel-Hamas headlines last week, gold went up even when the Dollar went up and more importantly, even when yields were climbing. To me, this really indicated real fear. Going forward, we should keep an eye on how gold performs when the dollar and yields rise. It is a very telling sign.
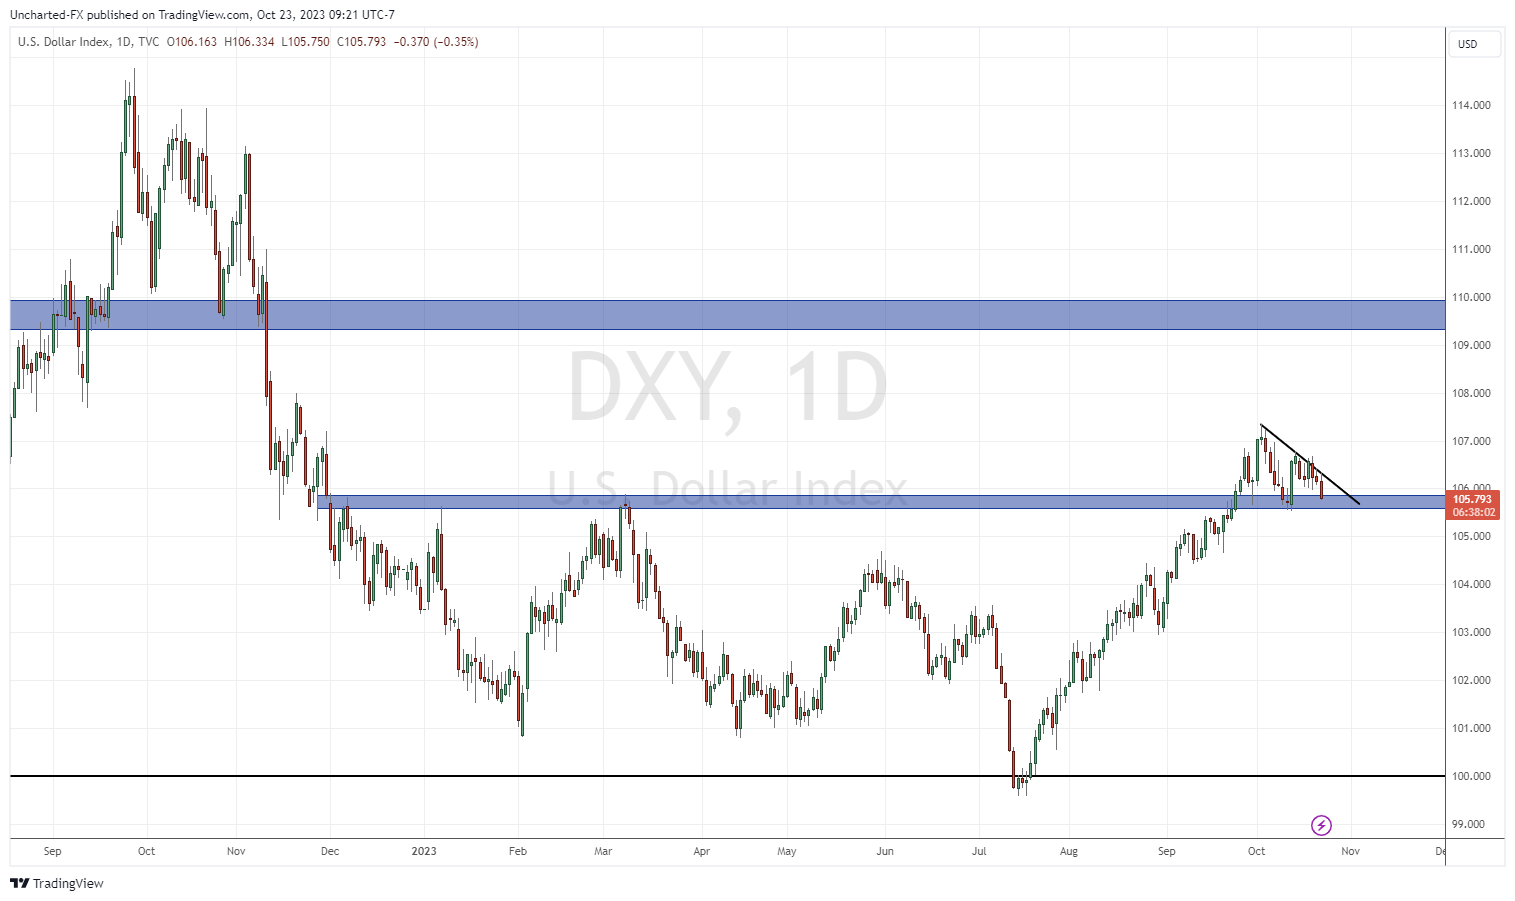
If we stick to the normal negative correlation between gold and the dollar, then gold bulls have some reason to be excited. The US Dollar did not breakout with geopolitical headlines. The trendline was rejected and the Dollar is testing support at 105.60. A breakdown would lead to a drop and potential trend reversal on the Dollar.
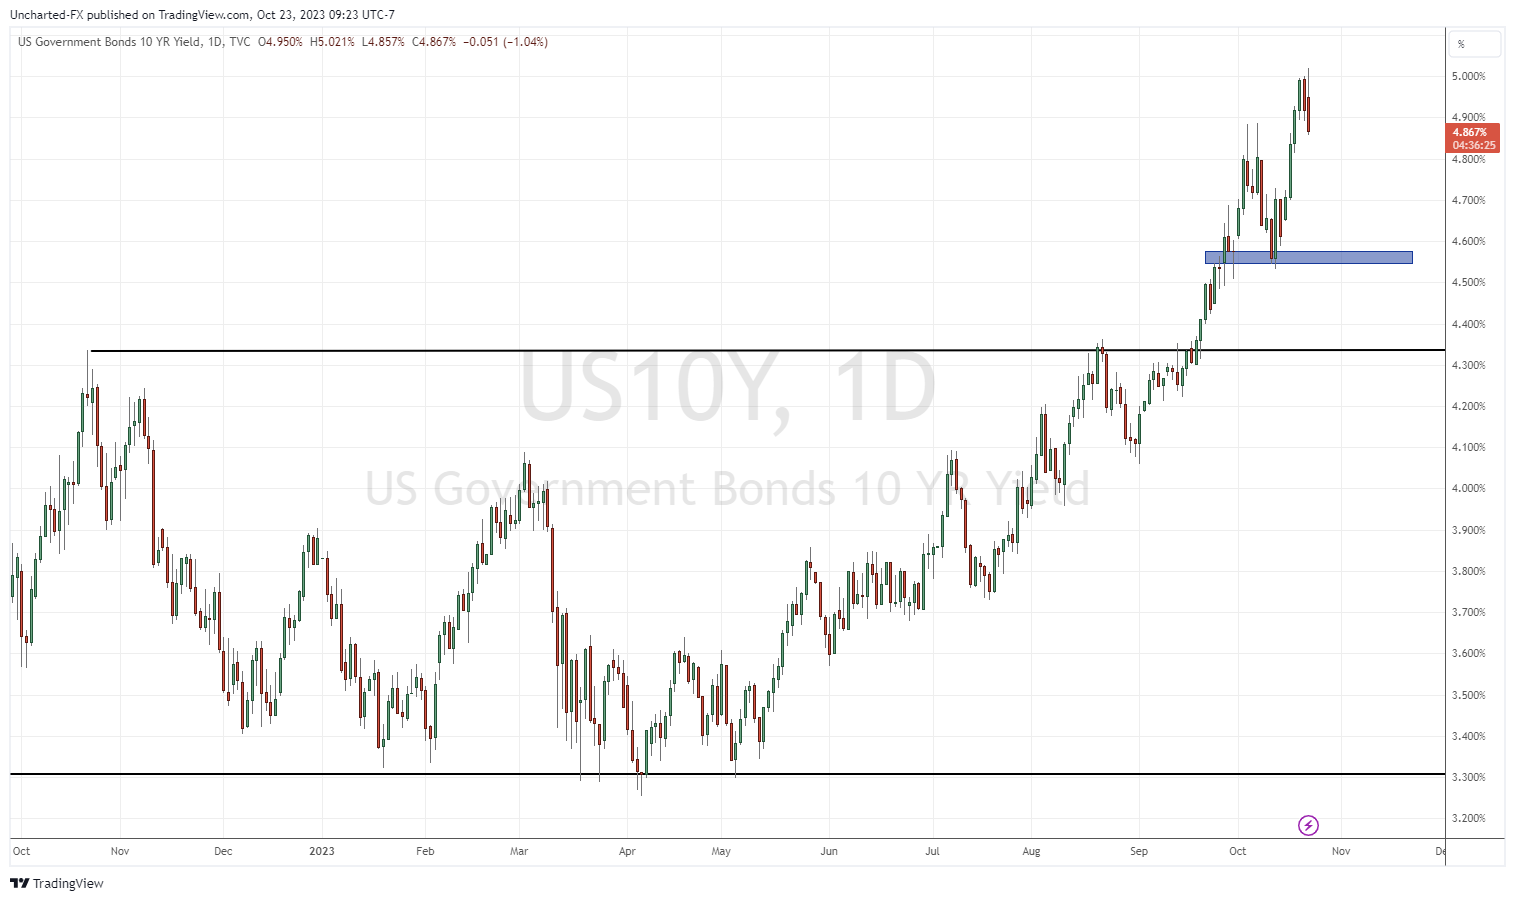
Bond yields are dropping today but still remain in an uptrend as long as the current higher low (marked in blue) remains intact. The 10 year yield did briefly break above 5% which made major headlines on mainstream financial media.
Yields have been moving on potential inflation expectations in case oil surges due to conflict, and also Powell’s comments on inflation still being too high and lower economic growth likely needed to bring it down. Interest rates will remain higher for longer given economic data like GDP and retail sales remain strong.
If yields continue to fall, then it would be positive for gold since the precious metal does not have a yield. It would also help the stock market jitters. It should be noted that during a risk off sentiment, when there is fear, money tends to leave stocks for the safety of bonds. A bid for bonds causes bond yields to drop.
Now let’s end off by taking a look at silver.
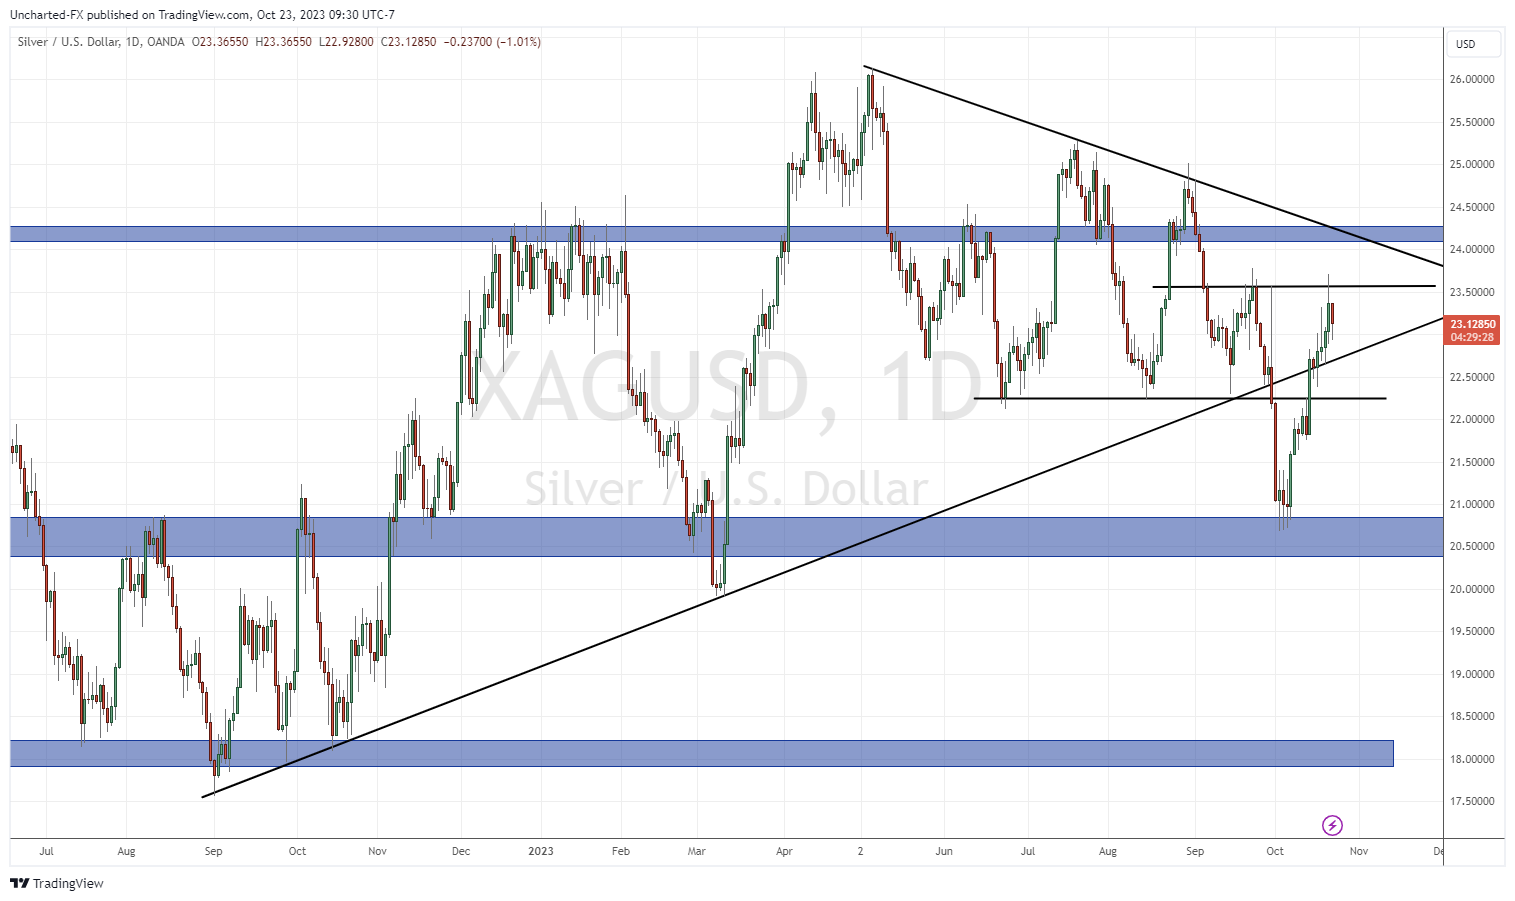
Silver is at an interesting point. As you can see, silver did retake the trendline and what was once resistance at $22.25. However, the lower high of $23.50 has not been breached. This means that technically, the downtrend can continue. What complicates things are the resistance levels above. After the lower high, we have the trendline and resistance at $24.25. A breach above $24.25 would be technically massive for silver and I believe you would see quite the momentum surge the day after the breakout.
So a key moment for silver here as well and as long as the price is above $22.25, there is a good chance silver will take out the current lower high and more.
Leave a Reply