Recent price action on US stock markets indicated that investors were expecting a dovish Fed. In fact, we have already discussed the major shift in Fed Fund Futures probabilities being the factor in stock markets rising.
Even with Powell indicating that the Fed will be pragmatic and more rate hikes may be needed, it seems like he has folded to market pressure. The market loves the Fed’s soft landing. The Fed has taken rates high enough to deal with inflation (even though it isn’t quite at the Fed’s 2% threshold yet) while preventing a recession (tbd).
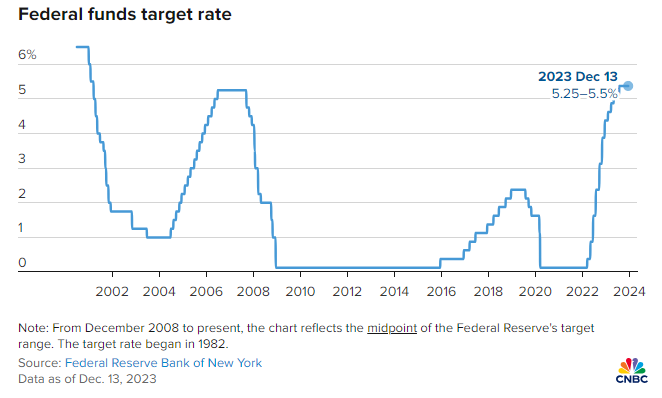
The Federal Reserve yesterday kept the key interest rate unchanged for the third straight time as was expected.
But what really got markets excited was the Fed dot plot. Along with its policy announcement, the Fed released updated economic forecasts in its Summary of Economic Projections (SEP), including its “dot plot,” which maps out policymakers’ expectations for where interest rates could be headed in the future.
Fed officials see the fed funds rate peaking at 4.6% in 2024, down from the Fed’s previous September projection of 5.1%. That suggests the Fed will cut rates by 0.75% next year. Or three rate cuts next year if we assume they are 25 basis point cuts.
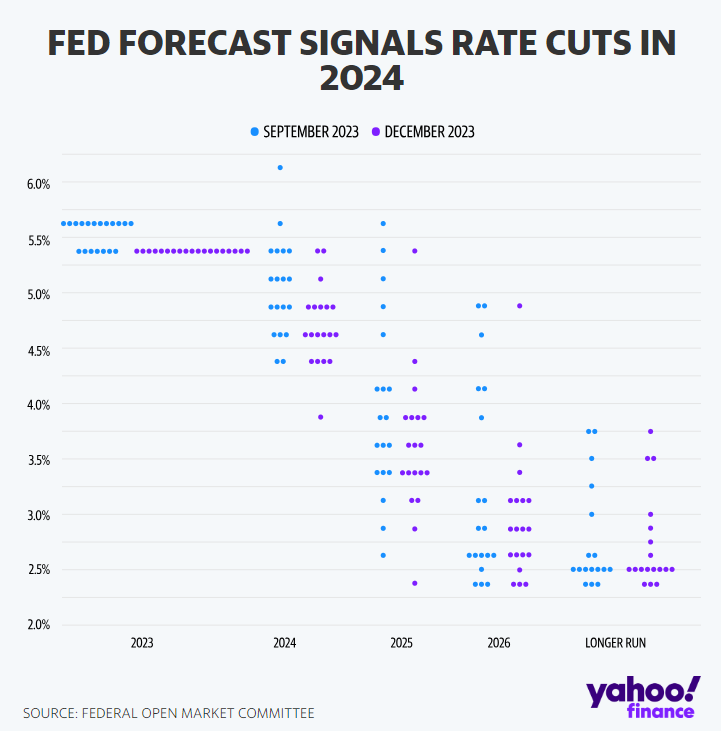
The dot plot also indicates another four rate cuts in 2025, or a full 1% decrease, and three more cuts in 2026 which would take the Fed Funds rate down to 2%-2.25%.
The SEP indicated the Federal Reserve sees core inflation peaking at 2.4% next year, lower than September’s projection of 2.6%, before cooling to 2.2% in 2025 and 2.0% in 2026.
The Fed also sees a deceleration in economic growth, with the economy forecast to grow 1.4% next year, down from September’s 1.5% projection, before picking up slightly to 1.8% in 2025 and 1.9% in 2026.
Markets love this, and could even be pricing in a more dovish Fed. What would shift moods? Besides some sort of black swan event, if inflation begins to pick up again, that would really get the market back in uncertainty mode.
Let’s take a look at the charts.


The S&P 500 and the Nasdaq are about to test a key resistance level… previous all time record highs. Given the current market narrative and what we heard from the Federal Reserve, it is very likely we breakout into new all time record highs.
These markets would follow the Dow Jones, which has already printed new all time record highs.
Personally, I don’t like to chase so I would wait for a pullback to retest the breakout zone on the Dow Jones. But playing the breakout on the S&P 500 and the Nasdaq is something many traders will do.
By the way, those who trade other markets may know that the German Dax and the French CAC have also broken out into new all time record highs.

I have personally played the Russell 2000. I jumped in on the inverse head and shoulders break which I discussed in a previous Market Moment article. I then rode the new uptrend. I am looking to add to my position on a correction.
By the way, look at how the price reacted today with a confirmed breakout yesterday. This type of pop can be expected on the S&P 500 and the Nasdaq if we get a daily close confirming a breakout.
But what will really get the markets going is the action in the bond markets:


As bond yields continue to drop, it will be stock market positive. Yields have switched to a downtrend and we have multiple lower highs and lower lows. A continuation lower is expected as long as we hold current lower highs.
Interestingly enough, the 30 year is testing a major support level. If this breaks, it just further supports the bullish stock market case.

The US Dollar is also dropping as investors price in rate expectations. I did discuss the breakdown below the 105.50 level and we now have our second lower high in this new Dollar downtrend.

Lower rates tend to be good for gold, and it should be noted that gold has done well in a high rate environment (maybe indicating some other problems perhaps??). After dropping below $2000 before the Fed, gold has retaken this level post Fed comments. The uptrend continues and a daily close above $2075 is what will get the momentum going to print new all time record highs.
Leave a Reply