The theme for 2024? Rate cuts. Central banks are widely expected to cut interest rates this year. However, how many cuts is the big debate. Oh and now when those cuts will happen.
The contrarians out there are celebrating as they have said that the economy needs to take a dip to justify rate cuts. Demand has to take a hit in order to bring down those inflation numbers. CPI data is important, but it is worth keeping tabs on the labor data and the retail sales numbers. The recent US non-farm payrolls came out much stronger than expected. 353,000 jobs added in January vs 180,000 expected. A blowout.
The last FOMC meeting dampened the chances of a rate cut in March 2024 with Jerome Powell insisting the Fed will move carefully on rate cuts and with probably fewer cuts than the market expects.
Powell also said that a March rate cut is:
“probably not the most likely case or what we’d call the base case. I don’t think it’s likely the Committee will reach a level of confidence by the time of the March meeting to identify March as the time to [cut rates].”
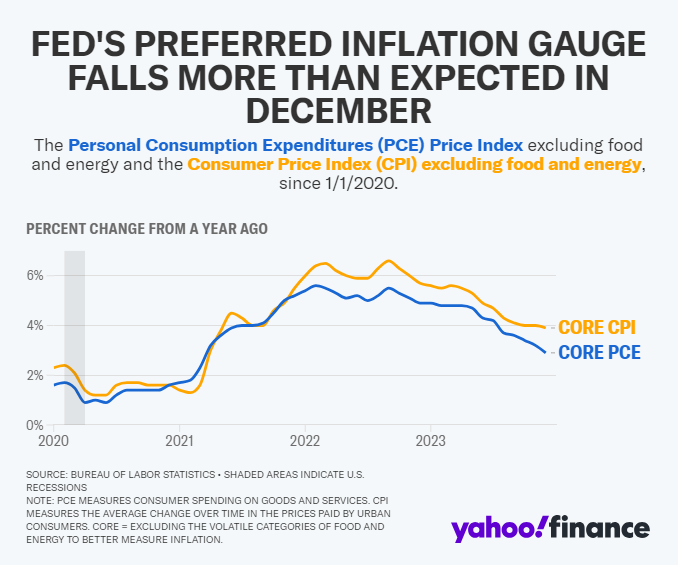
Why? The Fed needs to see “more good data” and a “continuation of the data we have been seeing.” Powell said the central bank would like to see “more evidence that confirms what we think we’re seeing” regarding the recent drop in inflation.
And in terms of a successful soft landing? Powell said it is too early to declare a victory against inflation:
“No, I wouldn’t say we’ve achieved that. We have a ways to go. Core inflation is still well above target on a 12-month basis. Certainly, we’re encouraged by the progress but we’re not declaring victory at this point.”

Over the weekend, Powell had an interview on 60 minutes. Powell insisted the Fed will move carefully on rate cuts and wants some more confidence before the Fed begins to cut rates.
Why is this? The Fed does not want to repeat the same mistake of the 70’s. The Fed began to cut rates and then inflation ran away again. The result? Paul Volcker raised interest rates to 20% to put a lid on inflation. Killing demand sharply.
In other words, the Fed wants to see good evidence that inflation is tamed… which likely means the slowing down of money velocity and a drop in demand. a slowing economy.
I am now watching the bond yields again:


Yields have been in a downtrend recently but for technical traders, this downtrend may just be a correction or pullback in a larger uptrend.
This means that bonds are selling off. Is it due to the Fed and interest rate expectations? Or is it because the market is now risk on?
In a risk on environment, money tends to get out of the safety of bonds and other safe assets, and flows into riskier assets such as stocks. Here is what we are currently seeing in the US stock markets:

The S&P 500 has printed new all time highs. The breakout above 4800 was key, and as long as the price remains above this level, the uptrend can continue. Just a warning about normal breakout price action: we tend to see the price pullback to retest the breakout zone before a continuation. So when the price does pullback or correct, just remember this point.

The Nasdaq also printed new record highs, thanks to some big earnings from technology companies. This is the index I watch for a risk on sentiment as the tech stocks tend to be growth stocks vs value. The support retest zone comes in at 17,000.

Meanwhile, the Dow Jones is also printing new record highs. As I have stated in previous articles, I use the Dow Jones to gauge foreign money inflows into the US.
The markets are still expecting rate cuts this year, and Fed comments have not done enough to spook markets. The trend remains upwards until certain key support levels are broken.
What about some other charts to watch?

Traders and investors should continue to watch the chart of oil. Especially given the recent and ongoing developments in the Middle East. If oil manages to breakout above the $79 zone, then we could see a surprise uptick in inflation.
Right now, oil is testing a key trendline. We could see a bounce here which would see the range remain intact. If oil breaks below this trendline, then it would be a strong sign the market expects a slowdown.

We do have to bring up gold. Quite frankly, in recent weeks gold has been a bit dull. We have just been in a range and we are waiting for a break. Some gold bulls might be frustrated here but check this out:

From a technical perspective, it looks like the US Dollar is set to rise up to the 106 level. Gold has performed well thus far given the Dollar price action. Let’s keep tabs on the Dollar. A stronger push might be enough to see gold break below $2000.


Leave a Reply