Besides Nvidia carrying the Nasdaq, the other major US indices have been a bit shaky. We will jump into the charts below. And as usual, the prime suspect is the action in the bond markets.
Of course this has a lot to do with the Federal Reserve and interest rate cuts.
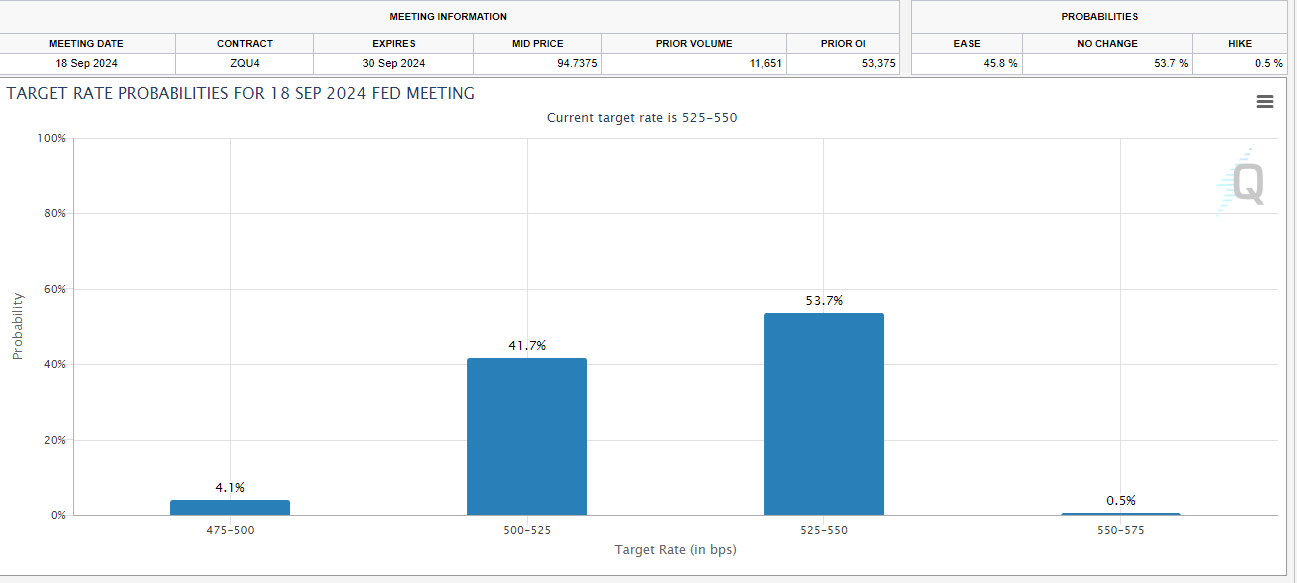
At time of writing, investors are not pricing in a rate cut in June or in July. September Fed Funds are currently showing a 45.8% chance of rate cut. These probabilities can of course change given economic data points like the CPI inflation numbers which are due next week.
Of course rates on loans and mortgages etc are determined by the movements in treasury yields. Movements in the bond markets. And there is some worry:
Both the 10 year and 30 year yields are popping. My readers may recall these charts as I pointed out that yields were testing key support zones on the charts. 4.35% on the 10 year and 4.50% on the 30 year. And it looks like yields are ready to breakout above recent highs and CONTINUE their uptrend.
As my followers know, given the market narrative of interest rates, when yields rise the stock markets feel the pinch.
Watch the upcoming test at recent highs. It is possible we do not breakout and instead pullback again. As of now, it looks like we are set to rise a bit more to at least test recent highs.
So what is moving yields higher? It is due to a government debt auction flop which is reflecting worries that the Federal Reserve will keep interest rates higher for longer.
Investors are still trying to determine whether the Fed will cut soon, or keep rates high for longer. This year began with calls for multiple rate cuts for the year, which has caused a nice strong rally in markets and other assets. But now we have a set up for the contrarians. What if rates will have to be kept higher for longer due to inflation? Yesterday’s stronger than expected consumer confidence data print doesn’t help the case for rate cuts as well.
“The recent data have clearly not given us greater confidence, and instead indicate that it’s likely to take longer than expected to achieve that confidence,” he said. “That said, we think policy is well positioned to handle the risks that we face.”
“More recent data shows solid growth and continued strength in the labor market, but also a lack of further progress so far this year on returning to our 2% inflation goal,”
The Fed will continue to be data dependent and we as traders and investors will continue to watch for signs in the bond markets.
Let’s take a look at the charts of stock markets.
The S&P 500 is at a crucial level. After breaking out above April 2023 highs to form new all time record highs, there has not been much momentum. On Friday May 24th 2024 we got a retest of the breakout zone which is normal. Most breakout traders and investors never chase but wait for the retest before jumping in. Buyers did jump in on the retest as indicated by the green candle on that day.
However, that retest did not see momentum carry the S&P 500 higher. We did not breakout above the 5330 zone. Now the S&P 500 is retesting the breakout zone once again. We have another battle between the bears and the bulls.
The intraday hourly chart has shown that buyers did step in at this support level. But as of yet, no momentum higher. Selling pressure remains.
With the failure to continue momentum on the first retest, it is likely probable that the S&P 500 is about to break below this support zone and form a false breakout. The next support would come in around the 5120 zone.
When I talk about momentum on a breakout, the Nasdaq provides a good example. The tech index has yet to see a pullback for the retest. Buyers have continued to pile in and really, it is because of one stock: Nvidia.
The intraday 1 hour chart is beginning to indicate that the Nasdaq is beginning to feel the pain of rising yields. A breakout higher failed and we are seeing the skeleton of a head and shoulders pattern on the intraday chart.
Meanwhile the Dow Jones has been weaker compared to the other two indices. Some are already pointing out the double topping pattern which could trigger. The fall has been attributed to the fall in UnitedHealth stock and the Dow’s unique price-weighted methodology compared to the S&P 500 and the Nasdaq rank components by market valuation.
But just as the S&P 500 is testing a key support zone, so is the Dow Jones. The intraday charts are not looking too good. However, we will wait for the daily chart to confirm a breakdown.
The small cap index, the Russell 2000, is also showing reversal price action. A close below 2042 would see a break and a potential move down to the 1940 level. Although I would watch to see how the price reacts at 2000.
With the move in yields, I would also be watching movement here in the US Dollar. With stocks selling off, and bonds selling off, we would be in a risk off environment with money running into the safety of the Dollar.
Of course price action in the Dollar can impact commodities.
The current market sell off is also impacting gold. And I see one more lower high swing here taking gold down to the $2280 zone. Unless gold can close back above $2380, we would then set up to test record highs.
As a bonus, let’s end off with some positivity.
Silver remains green. But bulls must understand it is testing a key resistance zone, the previous recent highs. To continue the rally, we would want to see a strong candle close above $32.50. Personally, I would not buy right at this point until the breakout or a pullback to better zones.
In summary: watch bond yields. A break higher will mean a stock market drop. Stocks look like they want to breakdown. Gold as well. We have a high risk event with inflation data next week.


Leave a Reply