This article will provide an update on the current technical set up on Bitcoin. Before we jump into the charts, let’s talk about some headlines making their way around mainstream financial media.
The world’s largest cryptocurrency dropped to a one week low as traders and investors awaited CPI and the Fed decision.
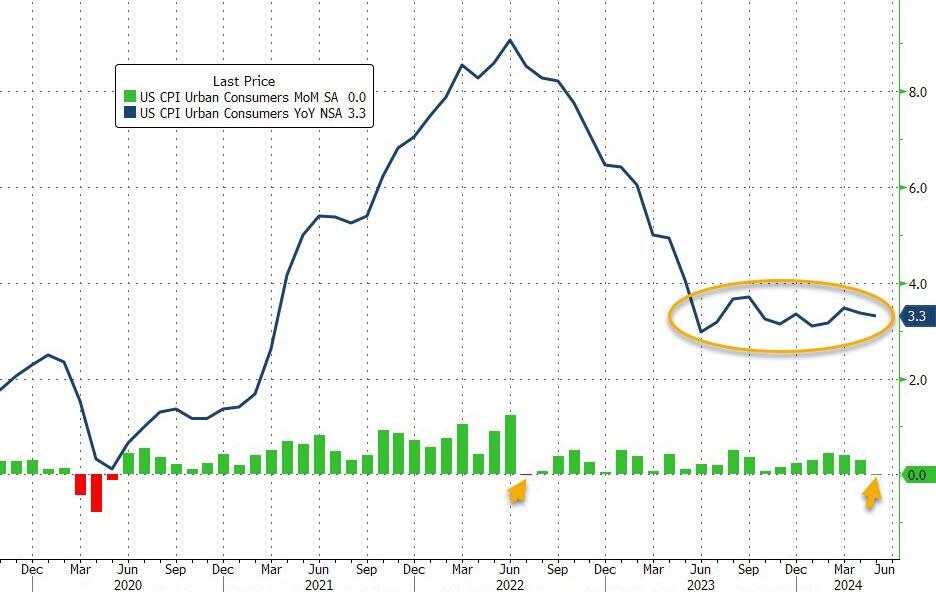
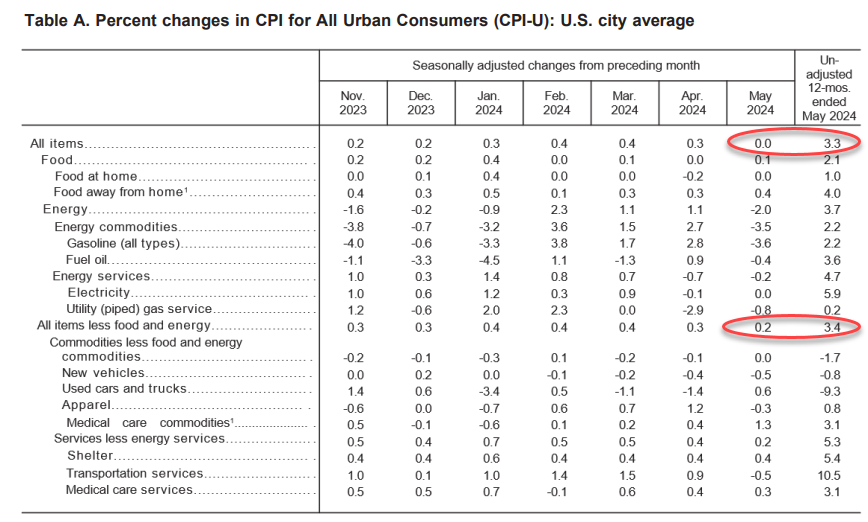
CPI for the month of May 2024 came in at 3.3% year over year, slightly lower than the 3.4% recorded in April. This is fueling markets and cryptos for a potential interest rate cut by the Federal Reserve in the coming months.


Ruslan Lienkha, chief of markets at YouHodler, commented on the current market sentiment:
“For Bitcoin, we’re seeing a favorable situation in the market right now. The cryptocurrency can overcome the resistance level in the zone of 71k-73k and renew all-time highs in the following weeks, driven by optimism in financial markets. Such positive sentiment is caused by expectations of coming interest rate cuts in the US and Europe that stimulate capital inflow into risk assets.”
In other news, the Bitcoin ETF saw a total outflow of $65 million on Monday. This is the ETF’s first daily outflow since May 9th 2024. This is likely due to the high risk events which were coming down the pipeline this week (CPI and the Fed Decision).
All eyes are on the Fed announcement later on today. No rate change is expected. But markets will be listening to Powell’s sentiment. If he mentions that the Fed needs to keep rates higher for longer, a hawkish tone, then the US Dollar would be supported which would see some weakness in Bitcoin and markets. A change in the Fed dot plot would also move markets and Bitcoin.

Bitcoin is contained within two major zones. $71,466 to the upside, and $61,832 to the downside. A break above or below these levels will set us up for the next major move. Currently, it looks like the upper portion of this range will be tested potentially leading to new all time record lows for Bitcoin.
Another major support zone was tested this week at $67,211. Today’s price action is seeing buyers step in right at this support level.

The lower timeframe gives us a stronger reason to be bullish. We actually had a breakdown of the major support zone highlighted in blue. This is why I wait for retests, because we ended up with a false breakdown or fakeout.
The bulls are in control.

The 1 hour chart is showing that bitcoin is meeting some resistance around the $70,000 zone. Looking to the left you can see why this is resistance. A strong close above this level perhaps after the Fed decision and Powell Conference would lead bitcoin to retest the $71,500 zone. And then from there, we watch for an eventual breakout into new all time record highs.
So in summary:
Bitcoin looks bullish above the $67,000 zone (my zone highlighted in blue). A close below this would set us up for a move down to the $61,300 zone. However with today’s CPI data, and the Fed potentially being dovish as a result, we are looking likely to test resistance. A break into new all time record highs will follow. Wait for a daily close above previous highs to confirm this.
Happy Trading.


Leave a Reply