Stock Performance
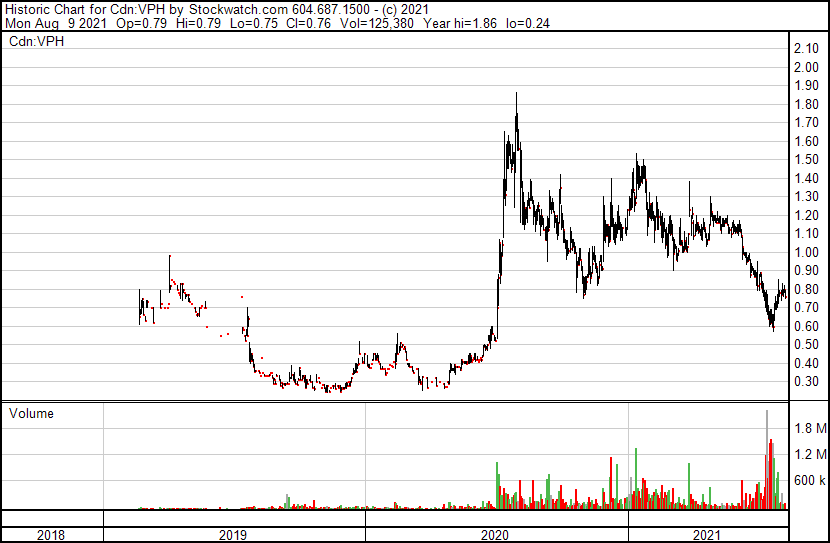
From the chart below it seemed like the Valeo Pharma (“VPH”) shareholders have had quite a wild ride over the last few years. Starting in 2019 the stock was trading at $0.72 per share, but by mid-August, the stock had dropped by almost 50% to around $0.30 per share before it did nothing for almost a full year until around June 5, 2020, where it was trading at $0.42 per share.
From June 26 till July 31st the stock gained over 170% ending that month at a 52-week high price of $1.56. Following that spectacular run, the stock plummeted and lost another 50% in market value in a period of 373 days. It only stayed at its 52-week high for about 8 days before this drop.

Usually, such a dramatic stock price performance can only mean one of a few things, either
- the business fundamentals are very volatile and the business experiences periods of booms and busts – sales, earnings, and asset focus
- there is a battle between the bulls (those who believe the business model is fundamentally sound and with his value) and the bears (those who think this is all a bunch of baloney) – market sentiment focus
For those who are more in tune with the financial mumbo jumbo happening in the financial academic space, this sort of market action really puts the efficient market hypothesis(“EMH”) front and center, and we can’t help but ask how valid it can be as the financial theory, but I digress.
Who are they?
Valeo Pharma is a specialty pharmaceutical company that specializes in the commercialization of pharmaceutical products with a primary focus on neurodegenerative diseases, oncology and supportive care, and hospital products. The company was incorporated in 2003 and is headquartered in Kirkland, Canada.
Its products portfolio includes:
- Redesca, a low molecular weight heparin biosimilar to treat and prevent deep vein thrombosis and pulmonary embolism
- Hesperco, a capsule that supports the immune system
- Onstryv, an oral medication for Parkinson’s disease
- M-Eslon, a narcotic analgesic for pain management; and
- Ametop Gel, a tetracaine hydrochloride gel for the percutaneous anesthetic to produce anesthesia of the skin prior to venepuncture or venous cannulation.
They state that their business objective is
“… to become an anchor Canadian healthcare Corporation by focusing on the commercialization of innovative products that improve patient lives and support healthcare providers.”
What’s been happening
Valeo’s business model consists of acquiring the exclusive Canadian rights to regulatory approved or late-stage development products, either through acquisitions, long-term in-licensing or distribution agreements with pharmaceutical companies that do not have a presence in Canada.
They also provide all the services required to register, to reimburse and to commercialize these pharmaceutical products in Canada.

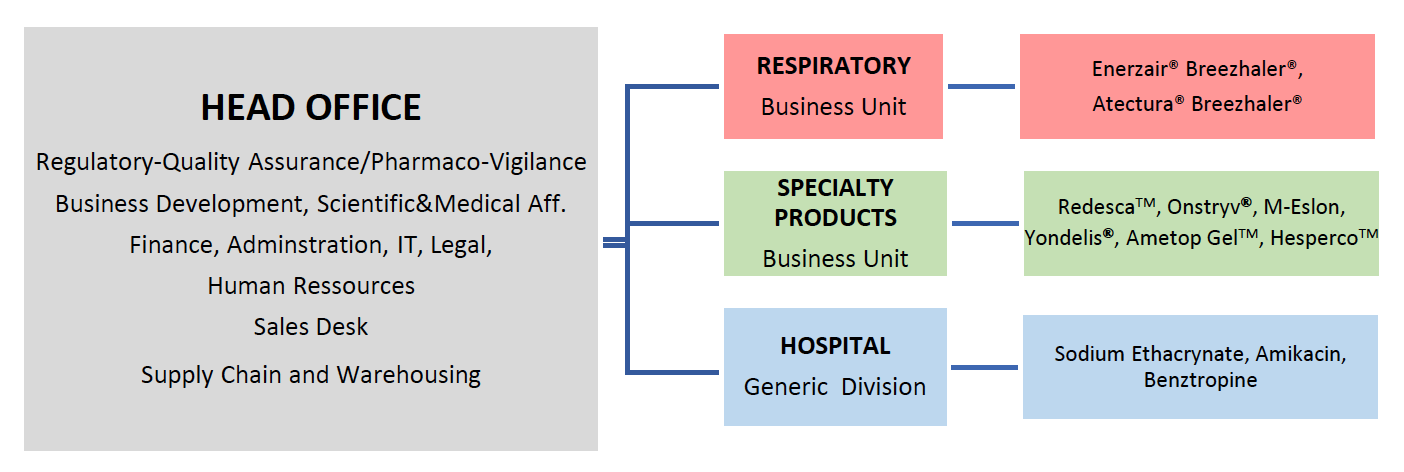
They have three main business units, (1) respiratory, (2) specialty products,s and (3) hospital.

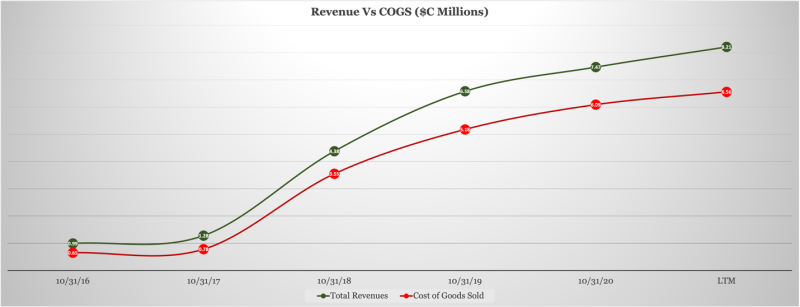
Now that we know what they do and how they generate their revenue it’ll be interesting to see if the business model is working. The chart above is a time-series chart of the revenue versus the cost of goods sold in Canadian dollars from 2016 to the last 12 months.
In 2016 they had $0.99 million in sales and as of the last 12 months, they had $8.21 million in sales compared to $7.47 million sales in 2020. This means in a period of five years their revenue base grew by 50% annually since 2016. But a closer look at the chart also shows that their cost of goods sold has also increased. In 2016 the cost of goods sold was at 0.65 million and as of the end of 2020, it was at 6.09 million, meaning this. COGS grew at a CAGR of 57%. Their growth in costs of production has outpaced take growth it booked revenues which is never a good sign.
For context, the space between the green line and the red line is the gross profit margin or money left after producing the goods and selling them to their customers. This money is usually what is left to pay for selling and https://equity.guru/wp-content/uploads/2021/10/tnw8sVO3j-2.pngistrative expenses.

So once the company has sold its products to the customers in need it needs to keep the lights going in the firm. As an owner of this stock, you would love to see over time the costs to run the firm either decreasing or growing at a slower pace than revenues. To kind of get an overarching view of how this has progressed over time, we can use a common size income statement where we take all the income statement figures that are important to our analysis and divide them by the total revenue as our base.
From the chart above you will notice two green lines for total revenue and gross profit meaning the business is profitable measured by those two-line items from the income statement. We should also take notice of the cost of goods sold percentage over time it’s ranged between 73% to 91% of total revenue meaning it cost them quite a bit to produce the final good for sale. Once they’ve produced is good, they need to pay their sales team which is a big component of their business model.
Their selling and general https://equity.guru/wp-content/uploads/2021/10/tnw8sVO3j-2.pngistrative expenses fluctuate I’m assuming depending on the corporate needs of the firm. The selling and general https://equity.guru/wp-content/uploads/2021/10/tnw8sVO3j-2.pngistrative expenses have ranged between 30% to 100% of sales.
A little less significant but also still important is the stock-based compensation expenses which have gone from 1% to 11%, and the interest expenses that have gone from 1% to 7% at the same time. This means they are paying out more cash and stock-based compensation than they were at the beginning and their debt expenses have increased as the company grows in scale.
From the number we see that
- As they expand their product portfolio and increase revenues cost of goods sold will also fluctuate and in this case increase with more production
- with this scale, they need more manpower and the sales force that will help set their brand on a path of profitability and market acceptance which increases their selling and general https://equity.guru/wp-content/uploads/2021/10/tnw8sVO3j-2.pngistrative expenses
- to fund some of their expenditures since they are not cashflow positive they would need to raise equity and debt financing and in the last few quarters, they have raised mostly debt which has increased their interest expense.
- They are now also more willing to compensate some of their employees with stock-based compensation which can be both dilutive and take away from the company’s total net income.
At some level, it seems the market has rationalized that the business might have very extensive cash needs to produce the final product which might squeeze margins in the future further increasing their cost of goods sold and decreasing their gross profit requiring the company to dig deep and raise more equity or debt to fund of day-to-day operations. It currently has a working capital deficit meaning they owe more than they own and this could be a sign of more hardships in the future for the firm in the short term. In the long term, it’s anybody’s guess hence why the stock is so confused.


Leave a Reply