What if I told you that there is an emerging mid tier gold producer that has been in the business for 50 year, began generating positive annual earnings in 2004, pays a dividend and recently began trading on the TSX. What if I told you that this company is expected to produce between 262,000-285,000 ounces of gold in 2022, and is largely going unnoticed by most investors. Well readers, I am not making up a fantasy. The company I am referring to is Mineros. A gold producer with a diversified asset base throughout Latin America.
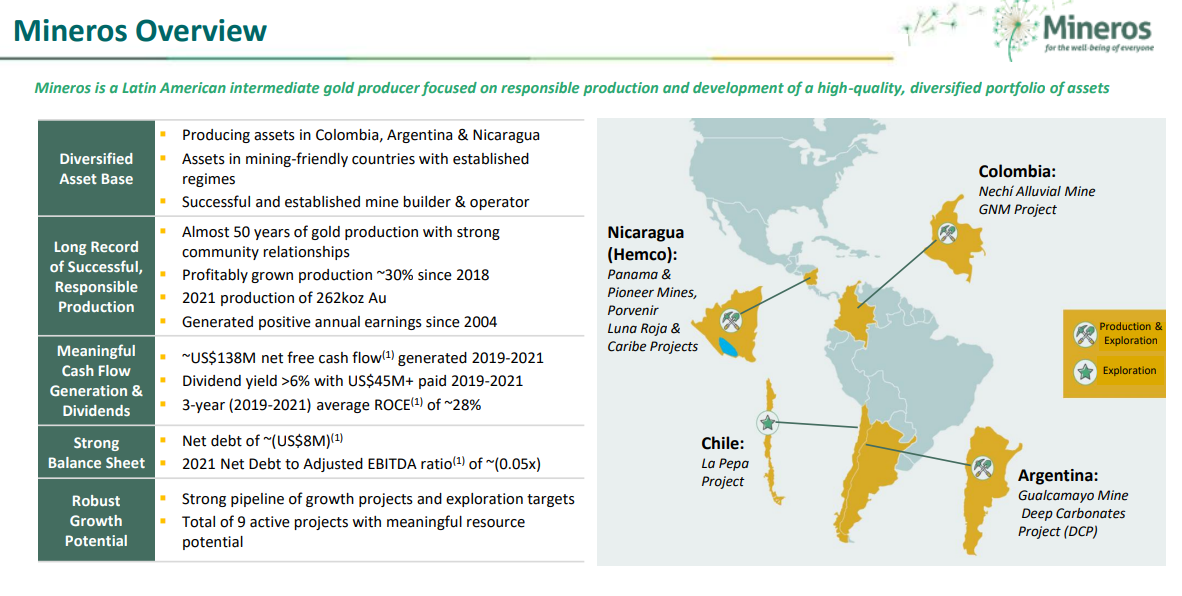
Mineros owns producing assets in Colombia, Argentina and Nicaragua. Jurisdictions that are mining friendly. Not only this, but the company has a strong pipeline of prospective exploration projects which provide potential for growth. A feasibility study is in progress at the Porvenir Project in Nicaragua. A PEA study is in progress at DCP and the La Pepa Project in Argentina and Chile.
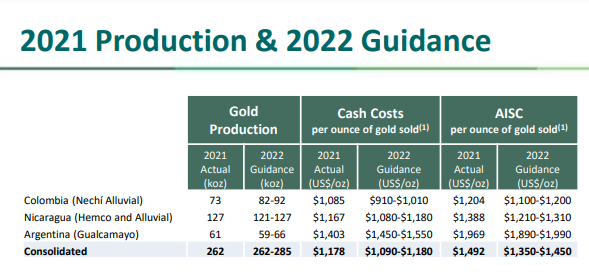
I mentioned a production guidance of 262,000-285,000 ounces of gold in 2022. To the left is a breakdown of the guidance, and the important all in sustaining costs.
Most of the production is coming from the Nicaragua mine. In terms of percentages of production Nicaragua will account for 45% (121,000-127,000 oz), Colombia 32% (82,000-92,000 oz), and Argentina (59,000-66,000 oz).
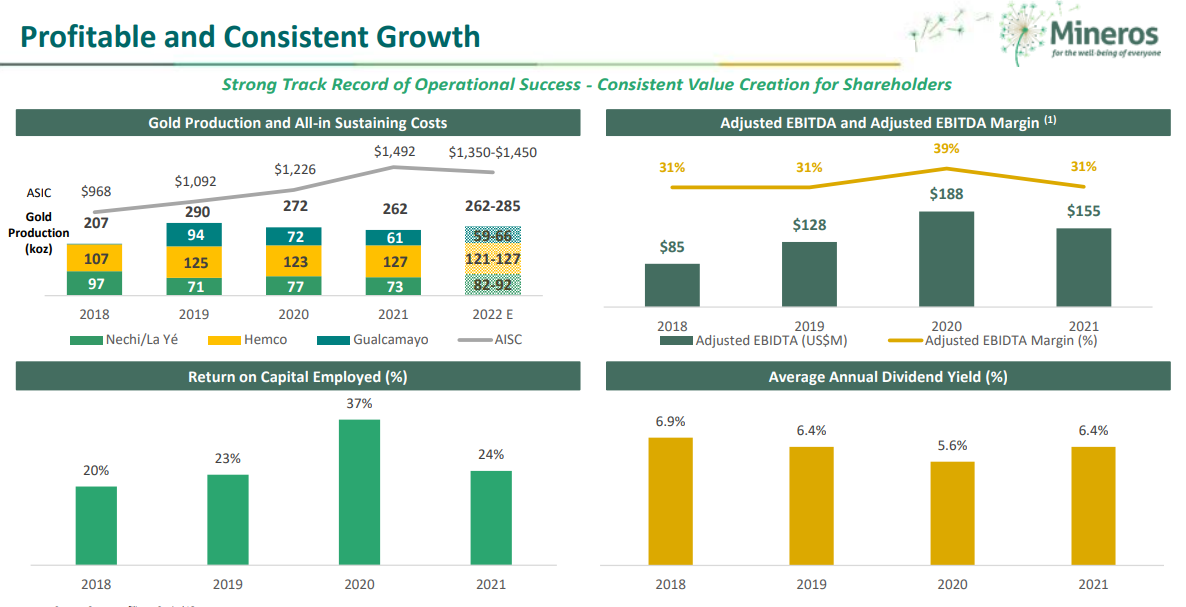
This is also a company with a strong operational track record. Mineros paid a total dividend payment of US $17.7 Million in 2021. As you can see with the dividend yield, Mineros has a strong track record of dividend payments with an attractive yield.
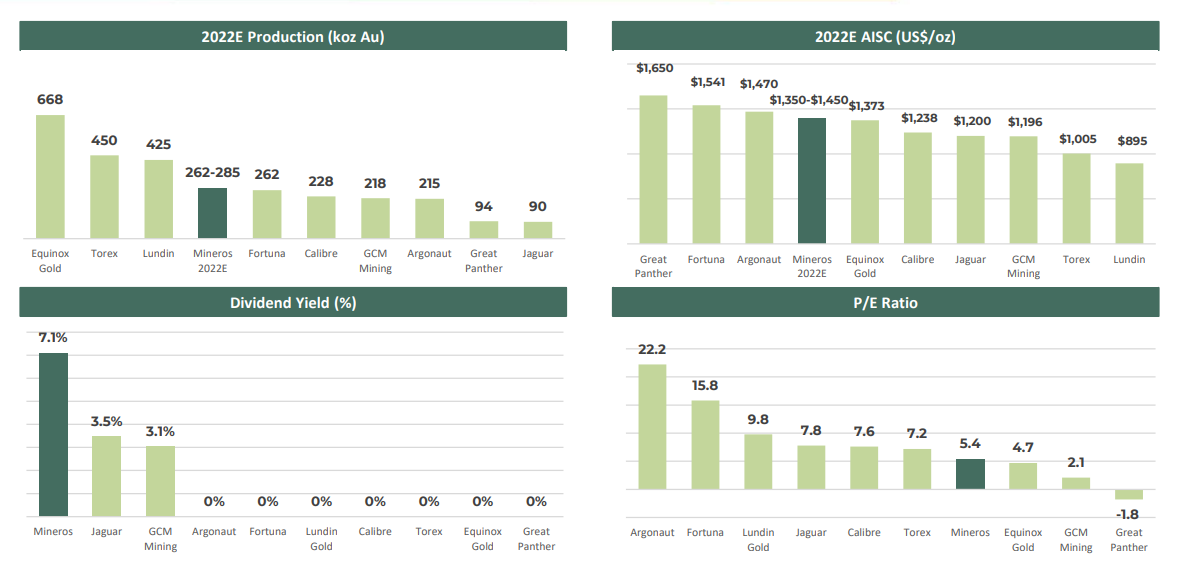
Here are some comparables for you to see how Mineros stacks up against its peers. Pretty solid stuff.
The company put out earnings for Q1 2022 on May 9th 2022. Here are some highlights:
- Gold production: Gold production totaled 66,009 ounces, an increase of 1% from the 65,473 ounces produced in Q1 2021.
- Cash Cost and AISC: Cash Cost per ounce of gold sold1 of $1,175 and all-in sustaining cost (“AISC”) per ounce of gold sold1 of $1,377, compared to $1,091 and $1,469, respectively, in Q1 2021. This represents an 8% increase in the Cash Cost per ounce of gold sold and a 6% decrease in the AISC per ounce of gold sold relative to the same period of 2021.
- Continued strong financial liquidity: Net Debt to Adjusted EBITDA1 ratio of 0.02x as at March 31, 2022, compared to a Net Debt to Adjusted EBITDA ratio of 0.10x as at March 31, 2021.
- Revenue and average realized price per ounce of gold sold: Revenue of $124.7 million, an increase of 1% compared to $125.4 million in Q1 2021, and an average realized price per ounce of gold sold1 of $1,884, an increase of 6% from $1,785 in Q1 2021.
- Net cash flows generated by operating activities: $5.3 million in net cash flows generated by operating activities in the first quarter 2022, a decrease of 59% compared to $13.0 million in Q1 2021.
- Dividend payment: $4.6 million in dividends paid in the first quarter of 2022, an increase of 30% compared to $3.5 million in Q1 2021.
“Mineros had a solid first quarter of 2022. With over 66,000 ounces of gold produced at an all-in sustaining cost per ounce of gold sold1 of $1,377, the Company is on track to achieve its 2022 guidance.” commented Andrés Restrepo, President and CEO of Mineros. “Mineros continues to pay a solid dividend with an attractive yield. At the ordinary meeting of the General Shareholders Assembly held on March 31, 2022, shareholders approved a 7.5% increase in the total annual dividend per common share relative to 2021,” he continued.
Mineros was listed on the Colombia Stock Exchange (BVC) in 1982. We will take a look at that chart below. In 2021, Mineros IPO’d on the TSX. The company raised US $34.3 Million in concurrent Canadian and Colombian offerings.
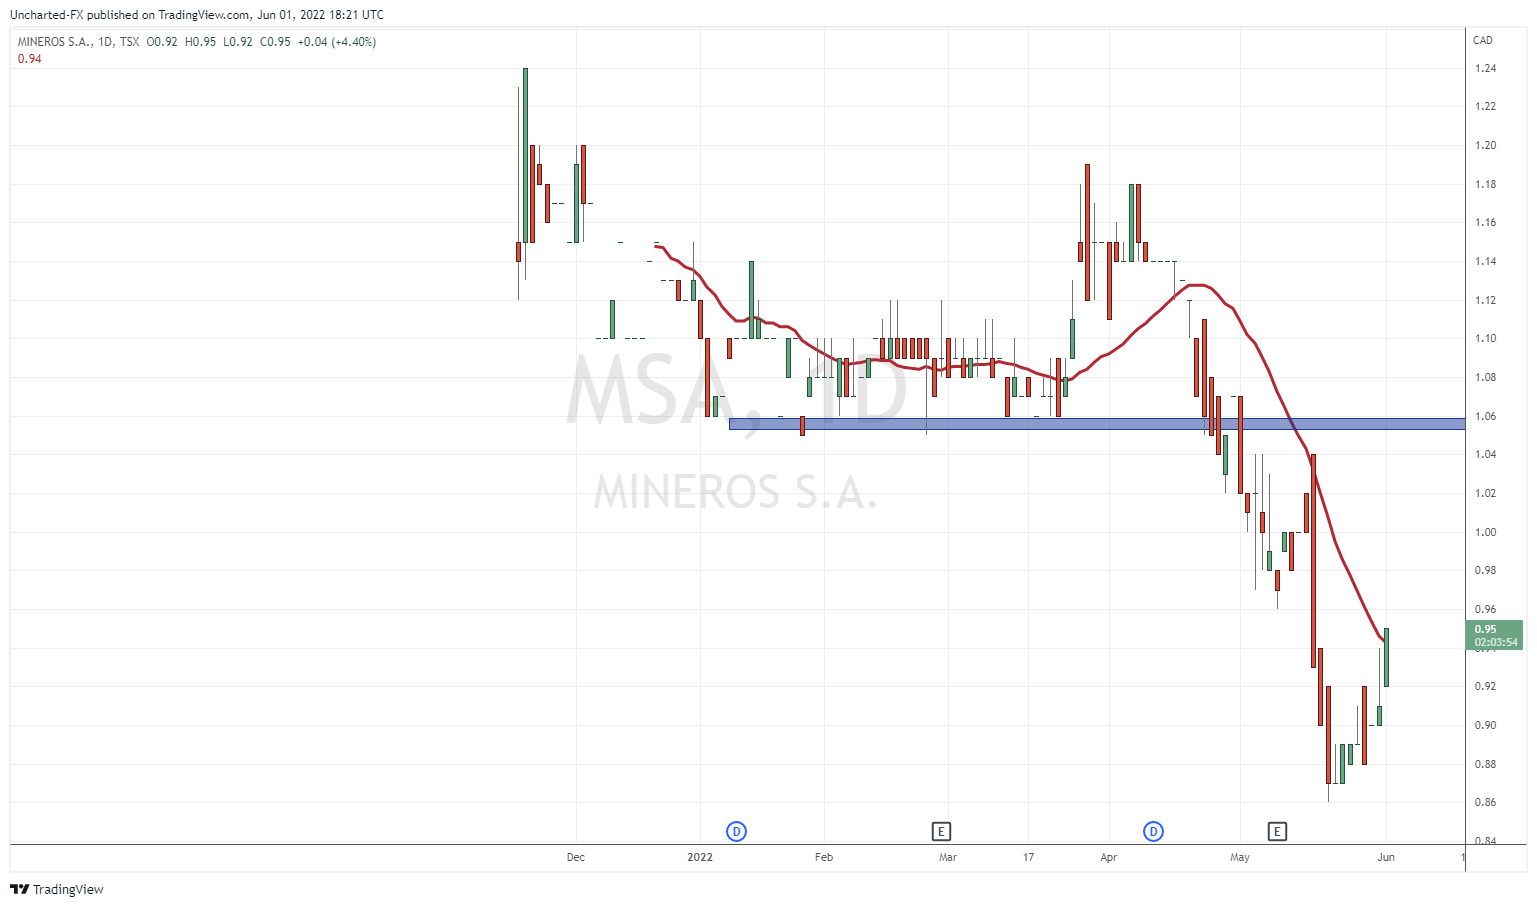
On the Canadian exchange, Mineros (ticker is MSA.TO) found some base at $0.86. It looks like we are heading back to the all important $1.00 zone. The major resistance I will be watching is the $1.04-$1.06 zone. What was once support now becomes resistance. If we can climb back above this level, this would be big for the Canadian listing.
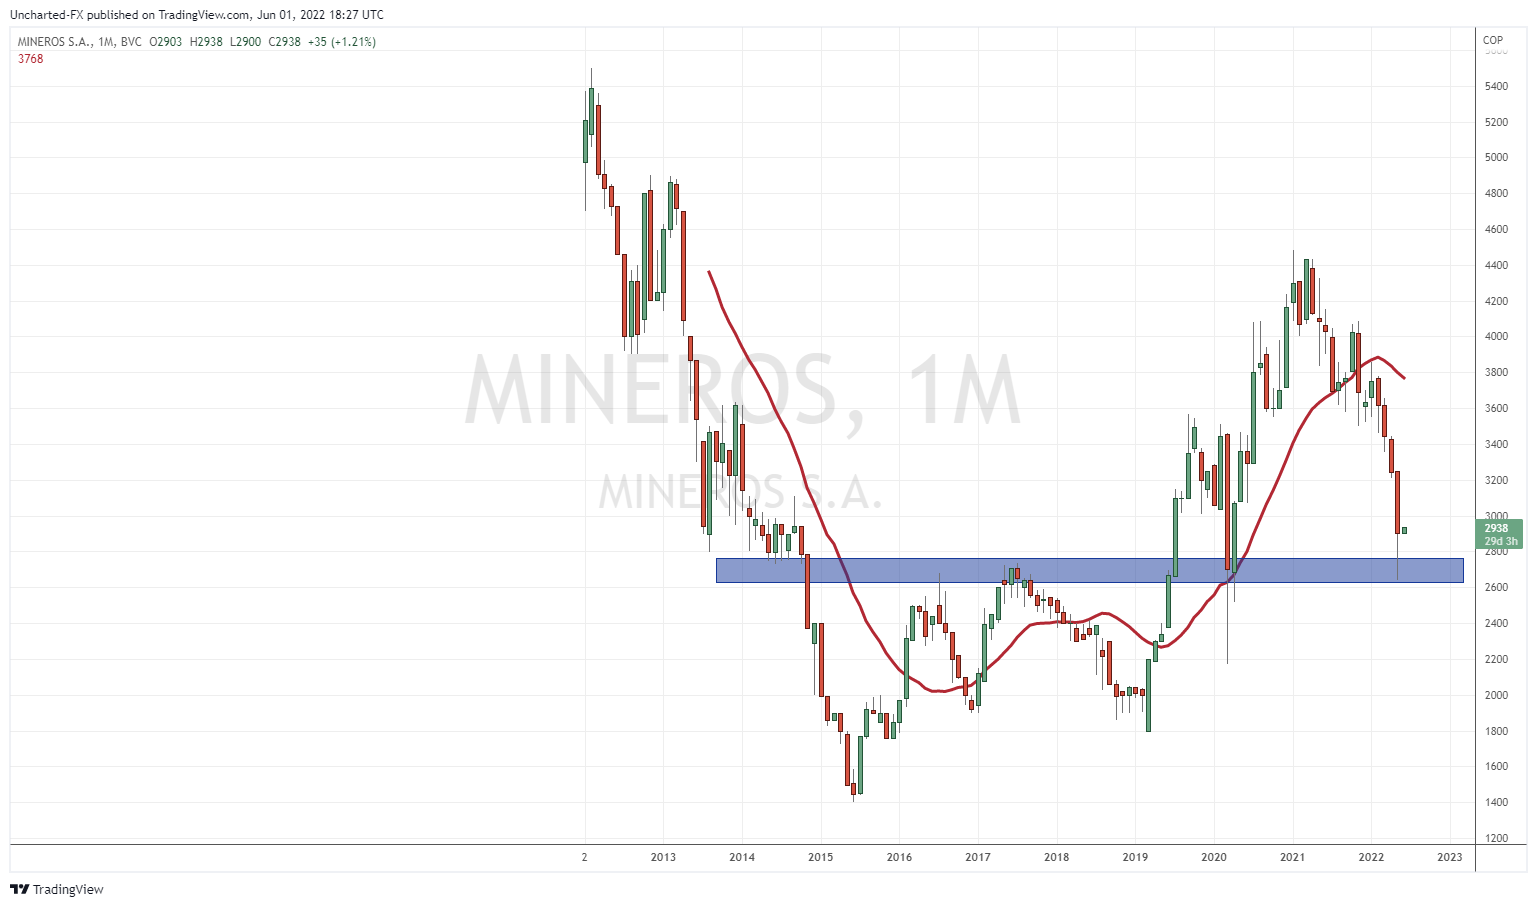
We have more price action to work with if we take a look at the Colombian listing. The daily chart set up actually looks the same as the Canadian listing. I have the monthly chart above because I spot something quite major. Mineros tested a major support level on the monthly chart at 2600. Note the monthly candle with the large wick showing buyers stepping in to buy at support. Now, I am watching for some sort of pattern to be confirmed on the daily chart at these levels. We do have a nice hammer candle for those more technically inclined already printed. Buyers are definitely stepping in here at 2600.
A move higher from here means it is likely Mineros does head to our resistance zone on the Canadian listing.
In summary, this is a gold producer that has been in business for a long time and is bringing in 200,000 plus gold ounces per year. The company also pays a consistent dividend and has many projects in the pipeline for growth and increasing production. The company has a track record of profitability, a diversified asset base, experienced management, a solid pipeline of projects, and a strong social license ( this is definitely a company that takes ESG investing very seriously!).
There are a lot of positives with Mineros and I would say the company is still under the radar. Hopefully this article will help to bring this story to the market and aid investors in considering a solid long term gold mining play.


Leave a Reply