Yup. You read the title of this article correctly. One of the best performing commodities of 2023 was orange juice. Some of you may be surprised that orange juice even has a tradeable market, but yes, one can trade orange juice futures and CFDs.
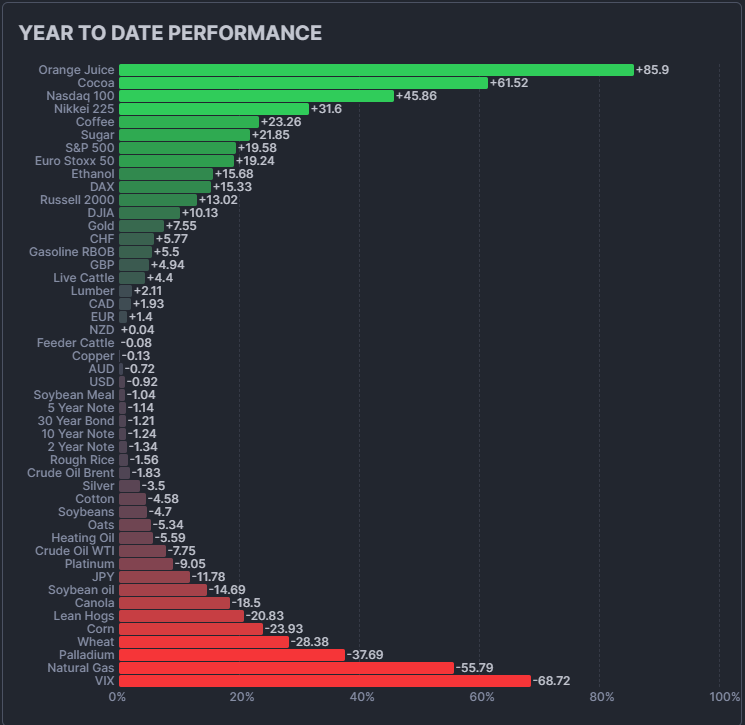
As we close out the year, let’s look at the year to date (YTD) of various assets:

As you can see, orange juice takes the top spot. Cocoa comes in second and for more information on this commodity, check out Gaalen’s recently released article on the cocoa market and all things cocoa. The top three are rounded out by the Nasdaq. The biggest losers were Natural Gas, Palladium and Wheat. Taking a look at the year end YTD performances is interesting and useful for contrarian investors and traders. Many look for the biggest losers to bounce in 2024 and therefore would watch for a bottoming pattern on the biggest losers.
When it comes to movements in currencies and equity indices, we of course have central banks and their policies which play a large role in how these markets move. The narrative driving equity markets has been central banks ending their rate hike cycle because they have tamed inflation and markets are pricing in rate cuts in 2024.
When it comes to commodities, things are different. Soft commodities like orange juice and cocoa do move due to weather conditions. Weather has and is getting more unpredictable which has led to problems with crops. The Cocoa markets experienced this when the top producer, the Ivory Coast, saw production fall due to a lack of rain and increasing dry rain. Supply and demand then saw cocoa prices rise.
The impact of changing weather patterns will be a theme for 2024 and onwards. In the past I have written many agriculture articles on Equity Guru with weather patterns being my top reason for why agriculture commodities will see huge volatility. And for the astute trader and investor, this will be an opportunity to make amazing yield. Just ask the orange juice, cocoa, sugar and coffee traders.
But will prices remain in an uptrend forever?

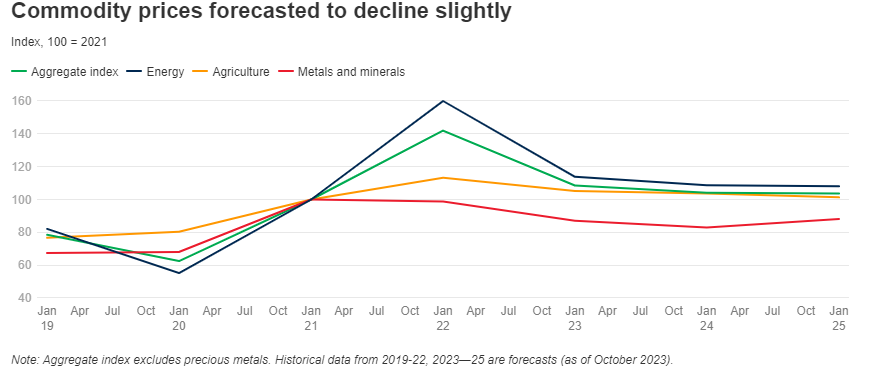
The World Bank commodity price index is expected to fall 4 percent in 2024, following a projected decline of nearly 24 percent in 2023, the sharpest drop since the pandemic. Energy prices are expected to decline by almost 5 percent in 2024 and remain relatively stable in 2025. Agriculture prices are expected to decline over the forecast period, while metal prices are set to fall in 2024 but see a 6 percent uptick in 2025. The forecasts assume that the conflict in the Middle East will have a limited impact on commodity prices, though geopolitical risks remain high. Disappointing global growth presents a downside risk, especially for industrial commodities. Additional trade restrictions and intensification of El Niño could push food prices higher.
However commodity prices still remain at elevated levels. But should see a pullback due to costs associated with transportation:
Commodity prices rose 5 percent in the third quarter of 2023, driven by a surge in oil prices. The start of the conflict in the Middle East in early October led to an initial uptick in prices, though the impact so far has been small: by end-October, commodity prices remained 29 percent below their June 2022 peak. The decline reflects a combination of slowing economic activity impacting metal prices and favorable weather conditions boosting agriculture yields. Nonetheless, prices of most commodities are higher than their 2015-19 average.
However, as I mentioned earlier, when it comes to agriculture and soft commodities, you do need to watch the top producers and crop yields which could be affected by weather.

When it comes to orange juice, you can see that the commodity spent most of 2023 in an uptrend as can be seen with multiple higher lows and higher highs. However, it appears that things are shifting and orange juice has broken the uptrend.
We do have a bit of a head and shoulders reversal pattern which has triggered. It is dirty and is not textbook, but the structure is there. Orange juice has gone from making higher highs and higher lows to lower lows and lower highs. It just triggered this reversal pattern recently with a close below $340.
Two things can happen here. Either this is a correction in an uptrend, or the beginning of a new downtrend. I count one major lower high at $380. We tend to see just one lower high in a correction. If orange juice can turn around and close above $380, the uptrend continues.
Alternatively, orange juice may not begin to make a move to test $380 until it first tests support at the $300 zone.
Let’s delve into more information on orange juice!
Orange juice is one of the only actively traded contracts that’s based on a fruit: oranges. Oranges are grown in the Western Hemisphere. The two big players are Brazil and the United States. Brazil is the largest producer of oranges but the United States, particularly the state of Florida, is also a major player.
Because of the perishable nature of oranges, the futures contracts track frozen concentrated orange juice (FCOJ). There are two versions of the FCOJ contract. One tracks the Florida/Brazil oranges (FCOJ-A) and the other tracks global production (FCOJ-B).
Weather impacts the production of oranges. Hurricane season in Florida can have a huge impact on the production of oranges and therefore the price of orange juice. For example this year, orange juice prices hit all time highs due to Hurricane Idalia. For a trader, weather and seasonality can be a leading edge when determining when to target and entry.


Leave a Reply